In the last chapter, you finally took the step to invest your money in the stock market by buying your first ETF as a Swiss investor. Congratulations again, because to have gone through this, it’s quite a step!
Now that your money is working for you while you go about your business (and that your IB account is secured!), you’re going to want to see how much you are earning from your investments!
How do I view the performance of my investment portfolio on Interactive Brokers Switzerland?
When talking about the performance of an ETF portfolio (and any other investment security) between two dates, there are two ways to view it:
- The performance in CHF, i.e. how much you have concretely gained between these two dates in Swiss Francs — compared to your initial investment
- The performance in %, i.e. by how much your portfolio has increased (or decreased, because yes it happens!) — compared to your initial investment
There are several places on Interactive Brokers to get this information, and they are constantly improving their user interface to make it accessible.
Personally, I either use the mobile app of the online broker when I want to quickly see how my portfolio is doing. However, when I want to see all the details, then I use the “Reports” view on my IB account as well as the PortfolioAnalyst tool of the best online broker out there (Interactive Brokers Group).
The “Portfolio” view of the IBKR mobile app
The mobile application of the brokerage firm managed by the founder Thomas Peterffy is well done, as it allows you to open it in “read-only” mode without having to re-login every time.
So it’s true that I generally advise beginner investors not to check their brokerage account every day, because they might get caught up in the game of trading — and therefore lose money in the long run.
But if we assume that you invest in “buy and hold” mode like me and that you know how to control yourself, then I will still show you this feature.
When you open your Interactive Brokers account through their mobile application, here’s what you’ll find:
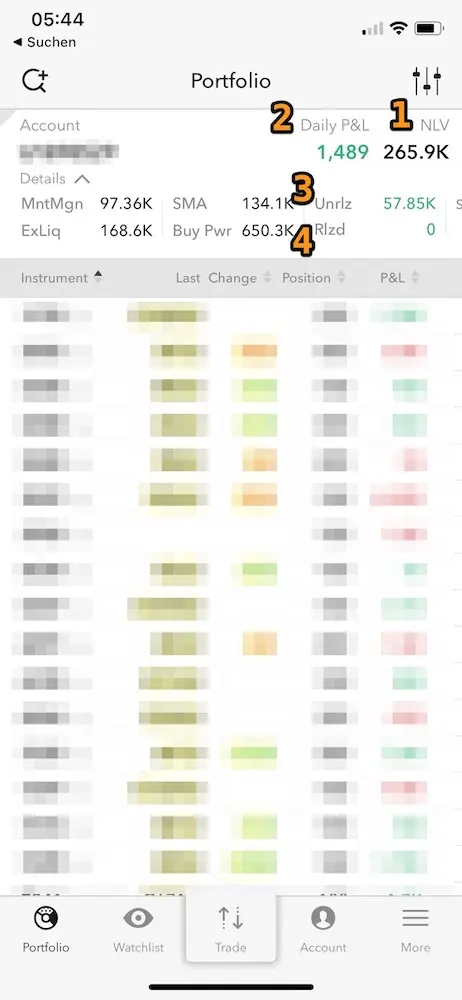
(1) NLV: stands for “Net Liquidation Value”. This is the amount of cash you would get back if you sold all your assets (ETFs, stocks, bonds, etc.) at the current market price.
(2) Daily P&L: is the profit or loss you have made since the day before. Imagine you invest CHF 10'000, and the next day your shares gain CHF 1'489, then you would see exactly this screen.
Personally, I never dwell on this value (whether it’s red or green, it doesn’t matter to me) because I’m not a trader who will buy or sell on a daily basis.
(3) Unrlz: this is the value I’m interested in. It corresponds to the performance in CHF that you have gained or lost since the first day you started investing with Interactive Brokers, and it is displayed in green or red respectively.
In the specific case of my screenshot, you can see that my portfolio has worked for me to the tune of CHF 57'850 since I started investing.
For your information, the “Unrlz” means “Unrealized” in English. Indeed, it’s a profit (or loss) that is a fictitious projection, because as long as I haven’t sold all my shares, I haven’t “really” earned this money.
(4) Rlz: on the other hand, the Interactive Brokers mobile app also displays the so-called “realized” profit or loss. If you sell securities and make a profit, then you will see the amount displayed in this section.
For my part, I look at the mobile app of Interactive Brokers to not miss a big stock market crash (knowing that I don’t often listen to the news), and thus an opportunity to be able to enjoy sales in the stock market :)
Interactive Brokers “Reports” section
When I first started investing in the stock market with Interactive Brokers, I would check my account from time to time (OK I admit it, every day…!) to see how much it was worth and if I had made or lost money depending on the market fluctuations.
But it wasn’t until some time later that I found the feature that I was most interested in and would answer questions I had: the “Reports” section.
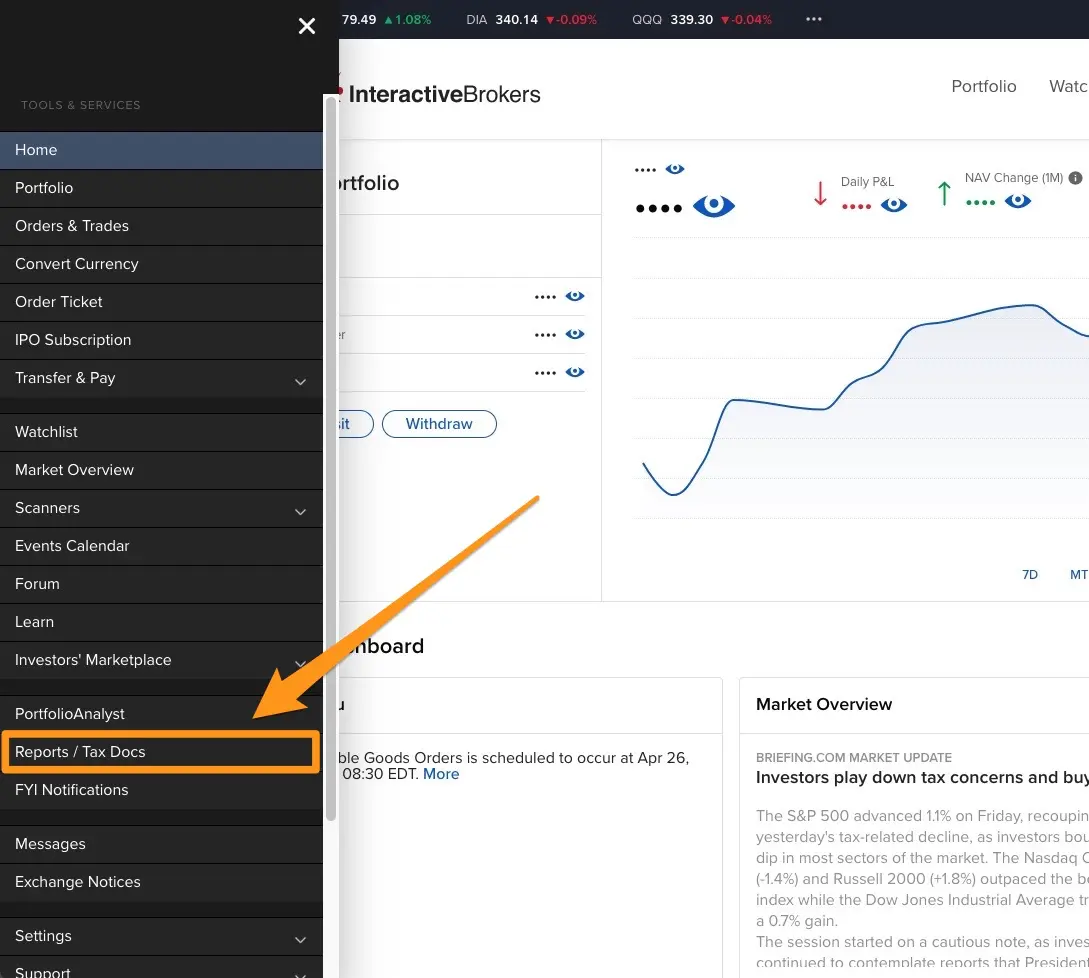
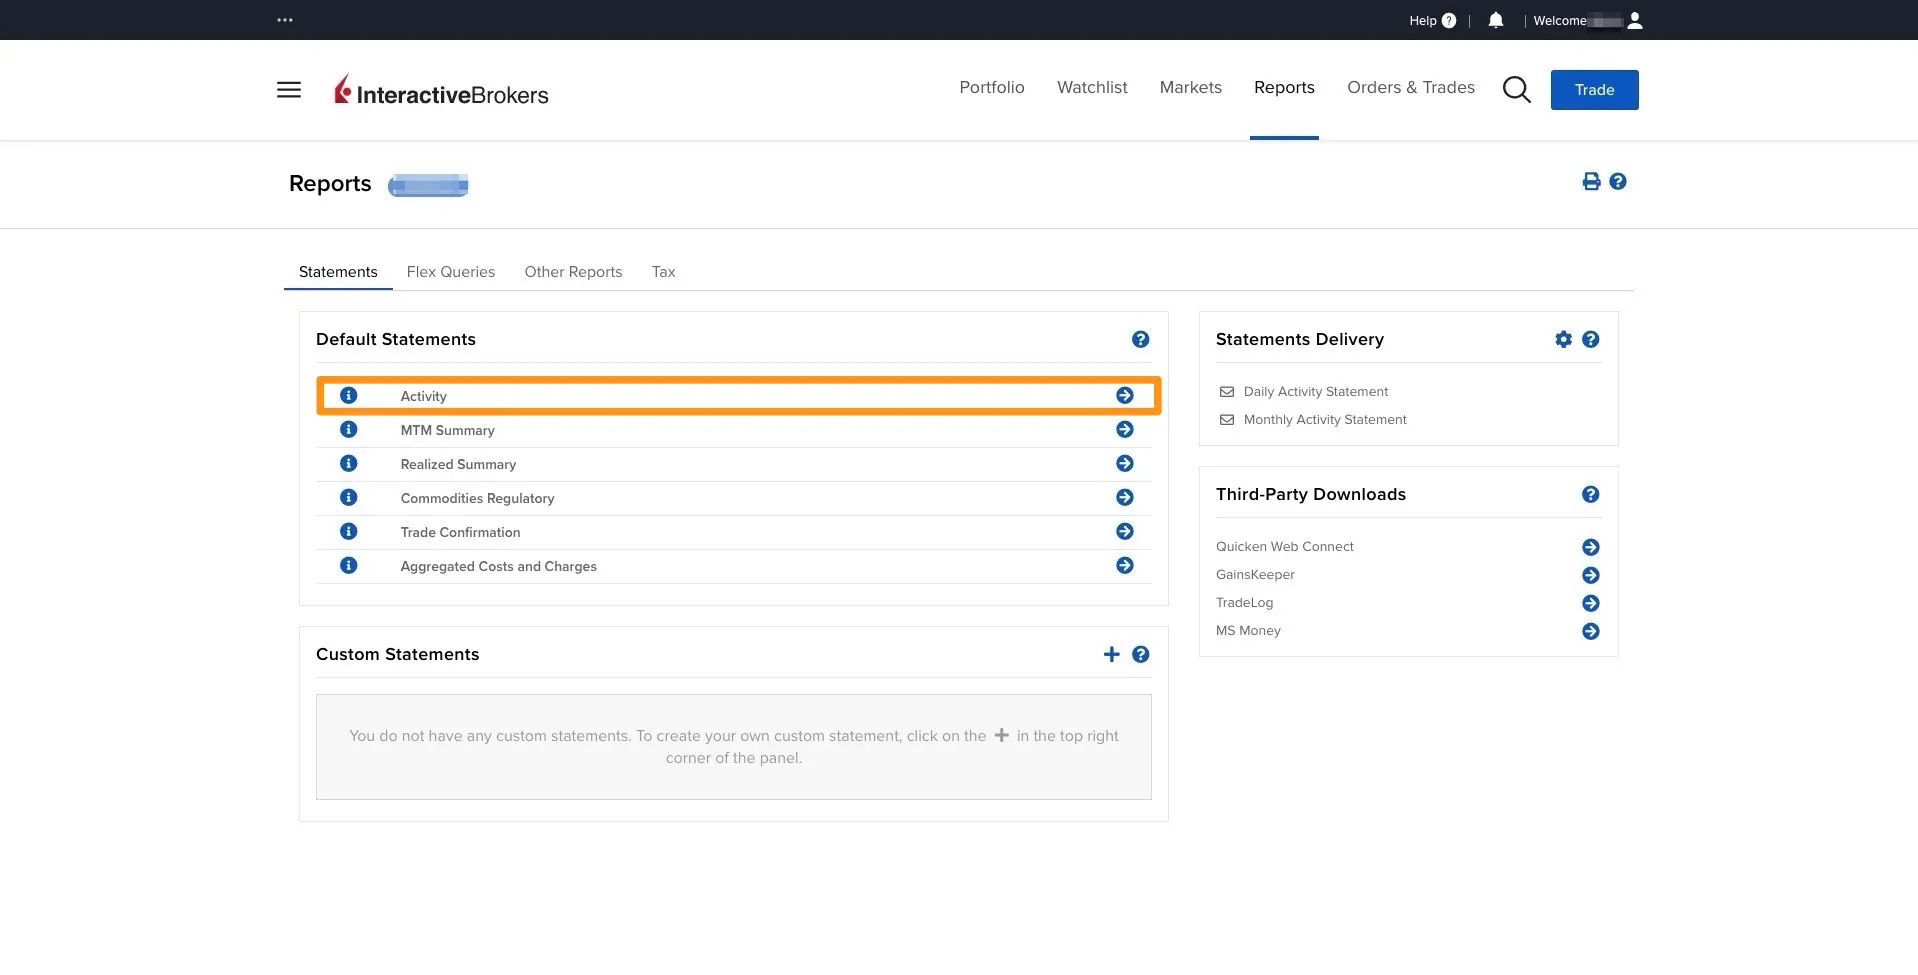
And more precisely, it is in the “Reports > Activity” section that I found my happiness to have the precise performance information of my ETFs (and securities) portfolio:
Let’s say that for the month of March 2021, I want to know how much I have earned in the stock market via dividends and capital gains on my ETFs.
To do this, I first need to choose the specific period of March 2021:
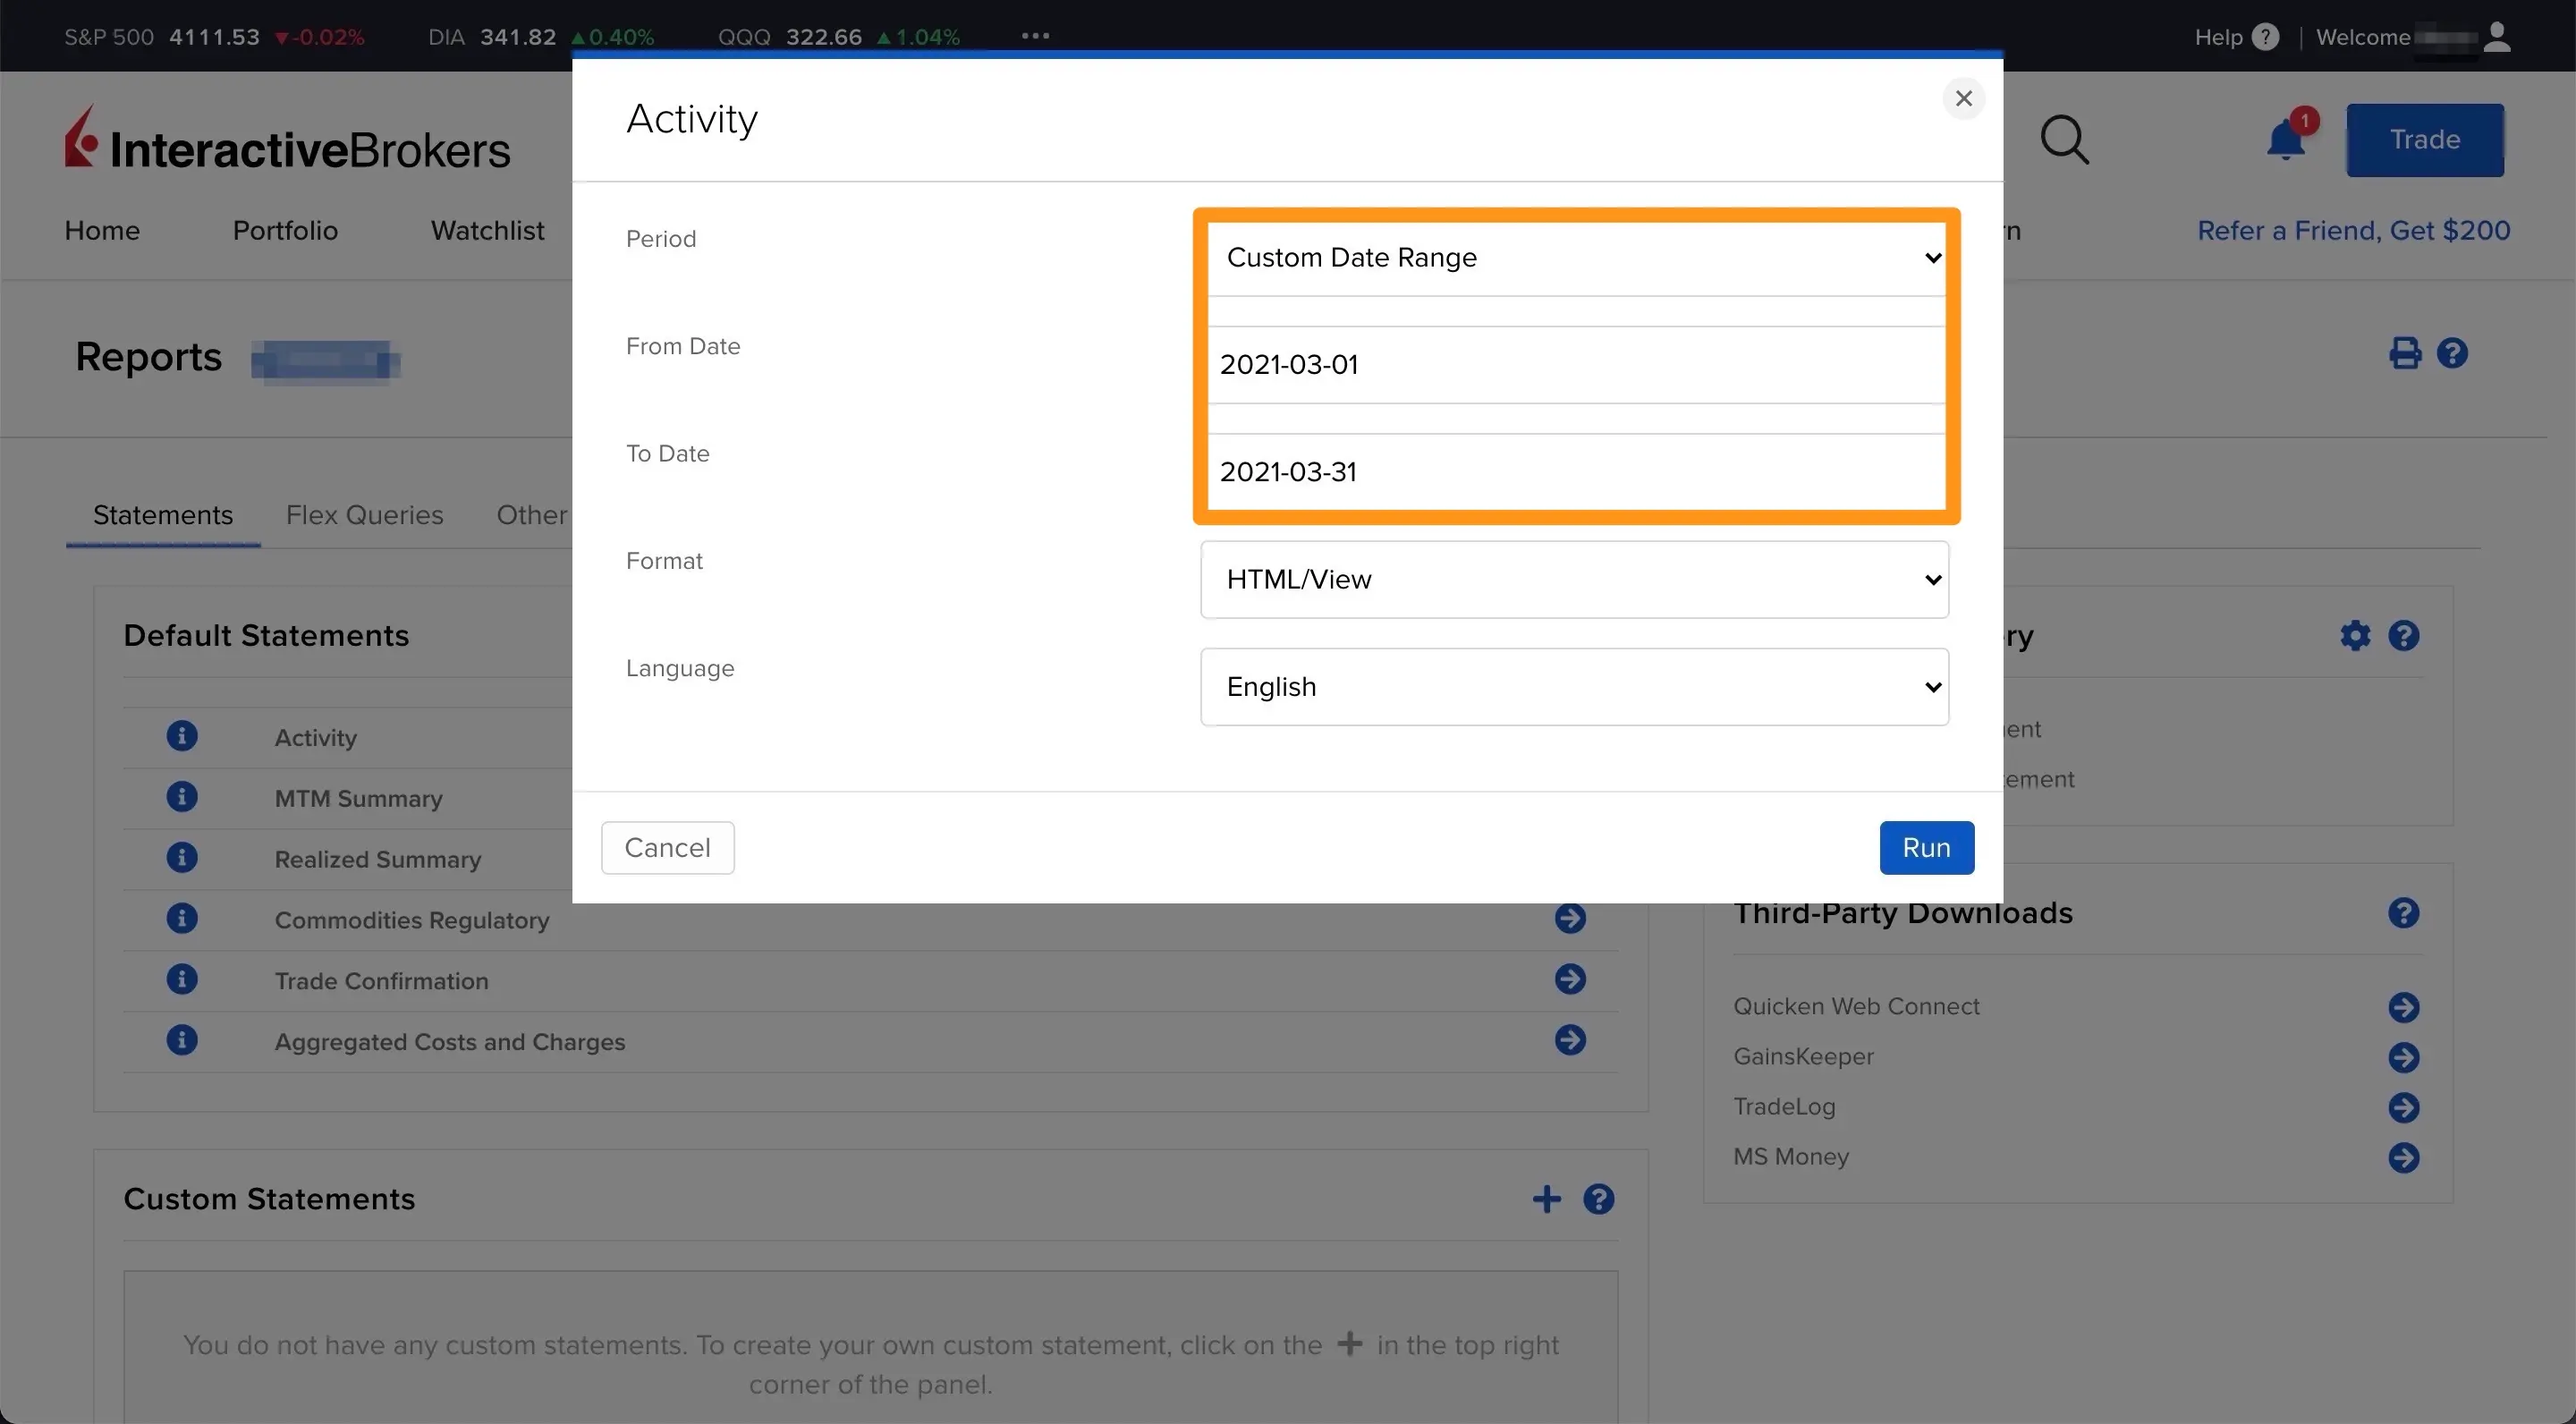
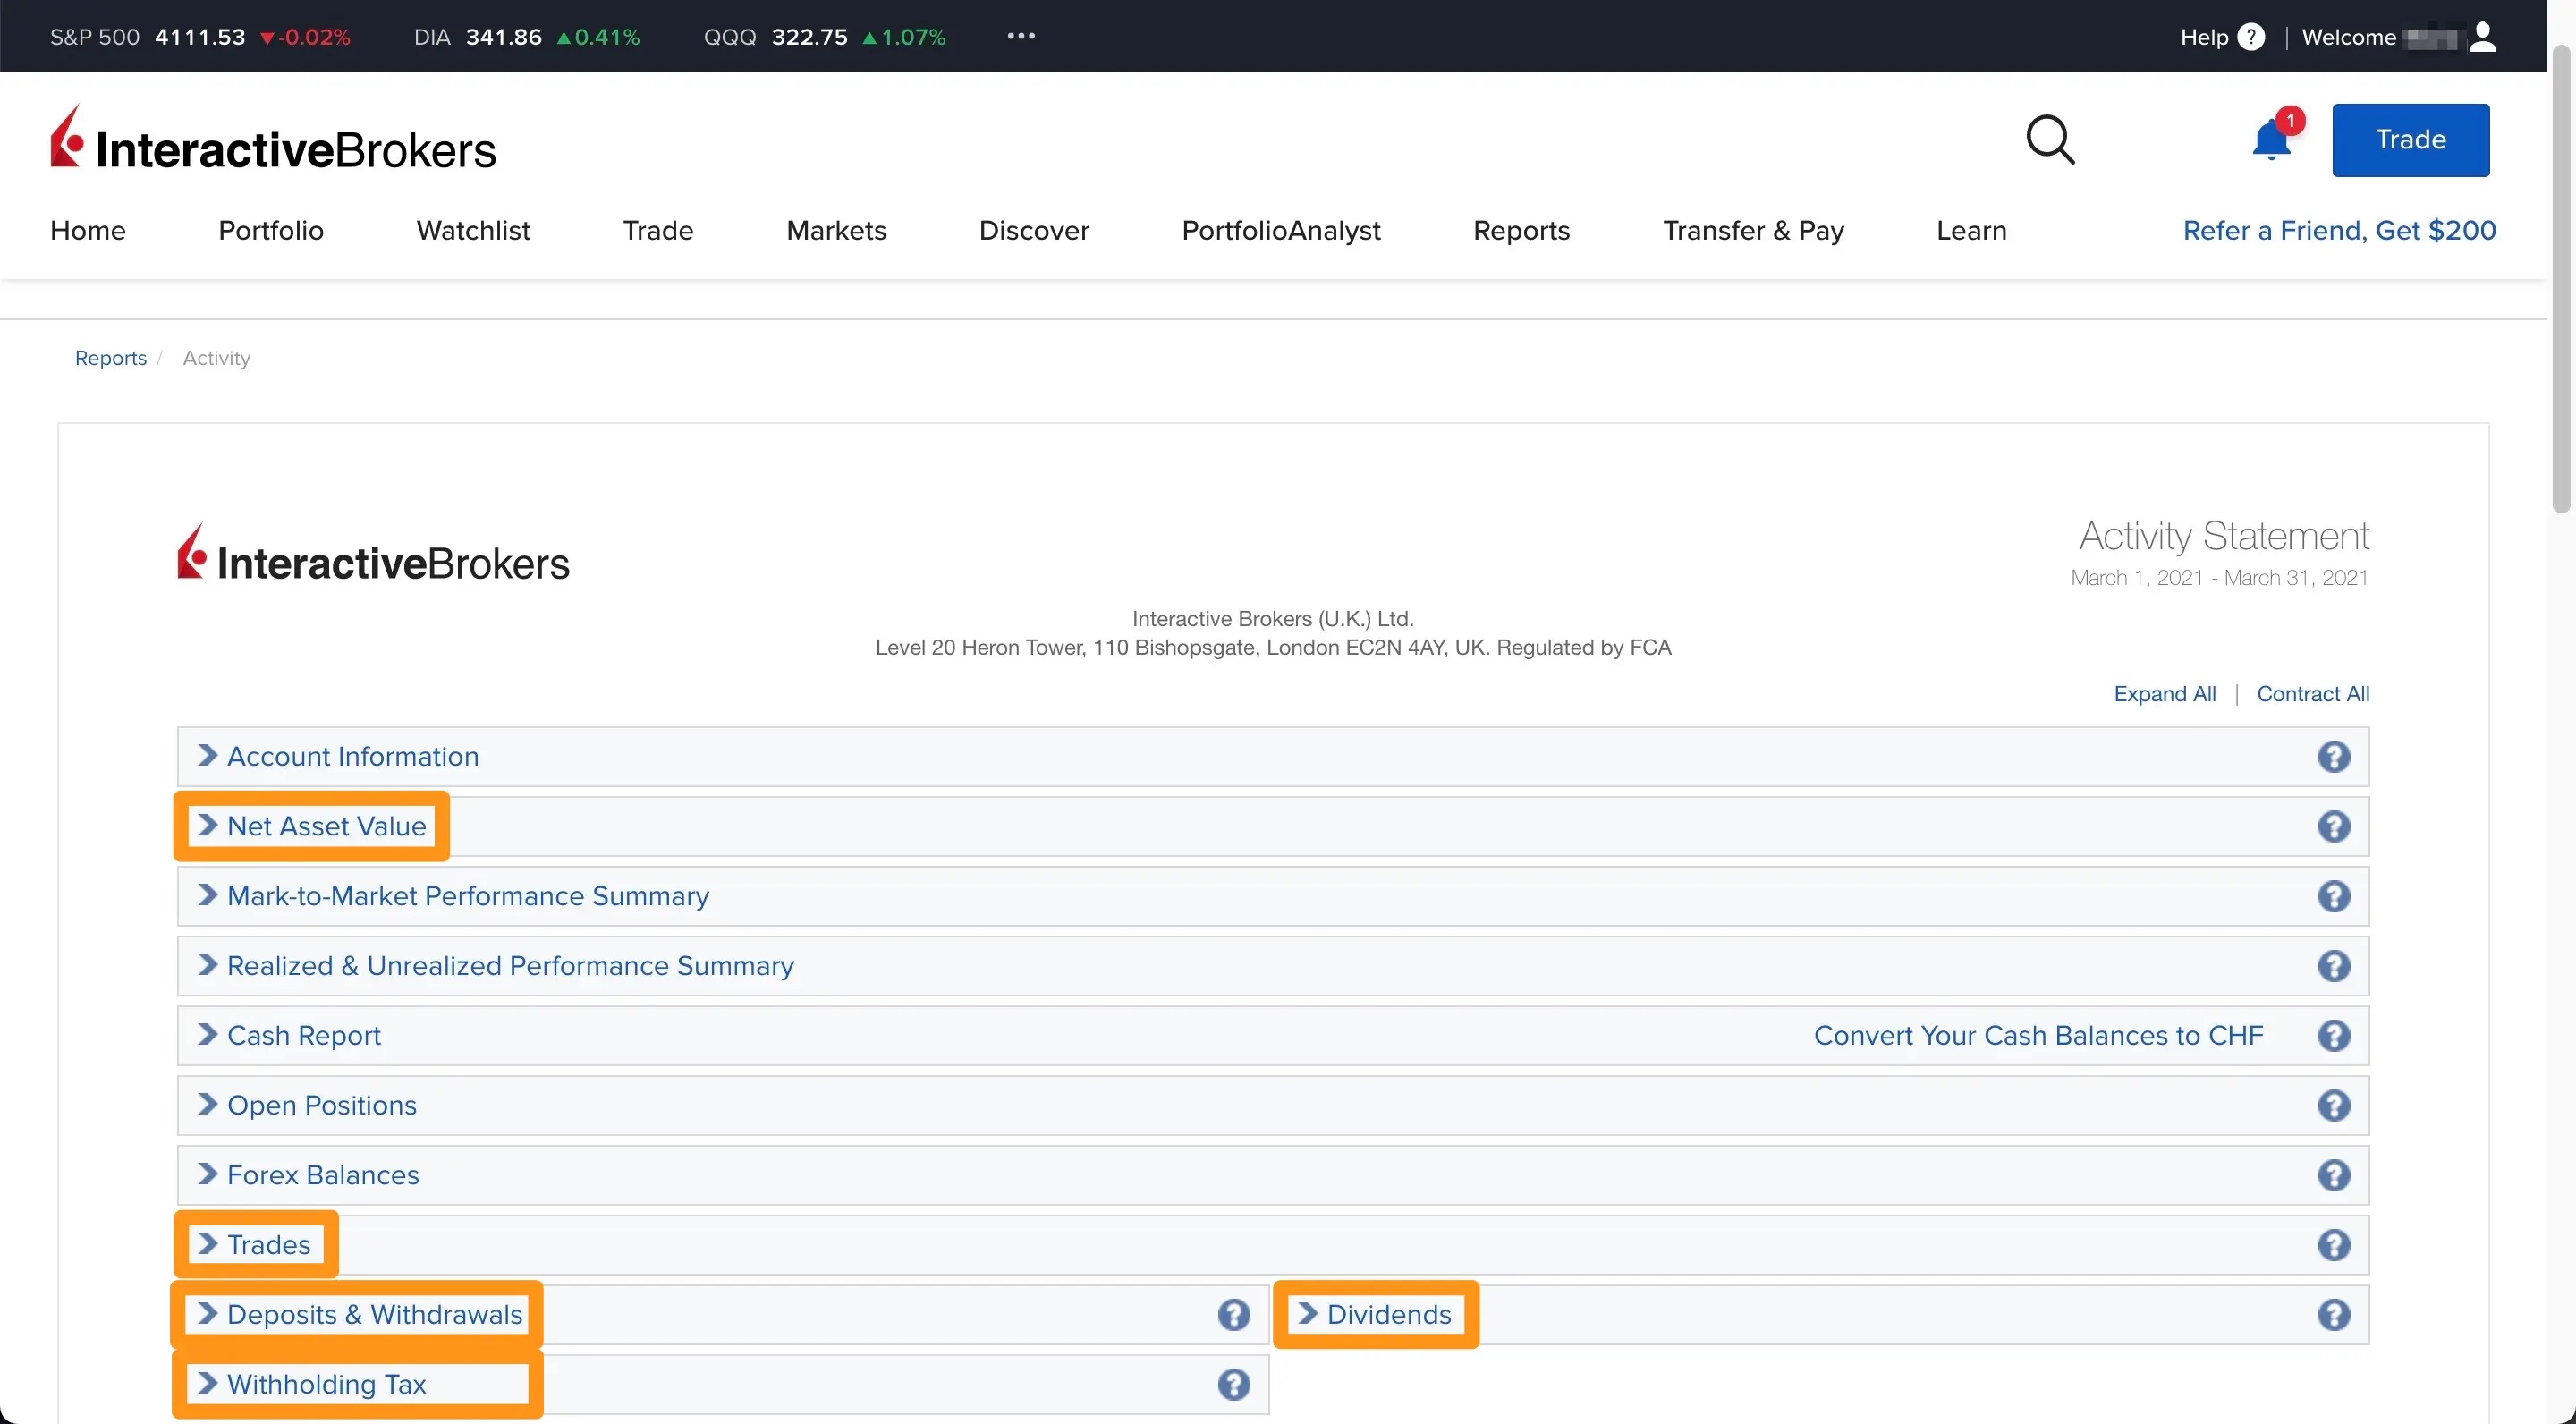
And we finally reach the Holy Grail of the Interactive Brokers activity report with the following 5 sections:
- Net Asset Value
- Dividends
- Withholding taxes
- Deposits and withdrawals
- Trades
Net Asset Value
The first section “Net Asset Value” is enough for you to see the key information of your portfolio for the specific period we have chosen, in order to answer the question “Did I make or lose money in the stock market?:
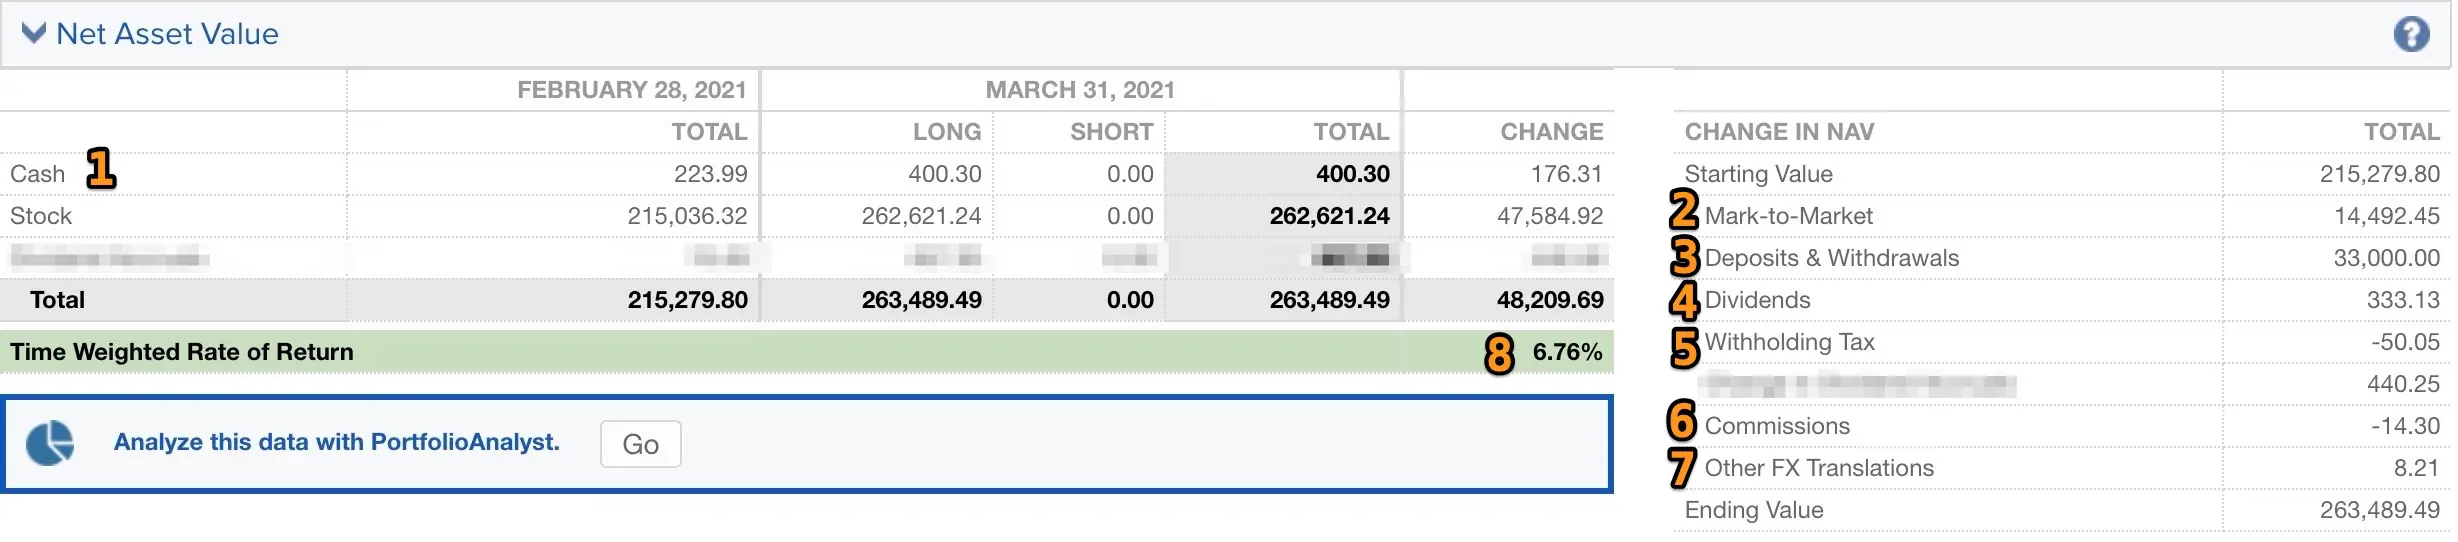
(1) The amount of your cash and your stocks is indicated at the beginning and end of the period. For example here, at the end of the last day of February, I had CHF 223.99 in cash and CHF 215'036.32 in shares, and at the end of March, I had CHF 400.30 in cash and CHF 262'621.24 in shares
(2) Mark-to-Market (MtM) indicates the gain or loss you made on your securities. Here, we see that I have gained more than 14kCHF in value
(3) Deposits and withdrawals refers to the amount you have deposited or withdrawn to your Interactive Brokers account
(4) Dividends is the amount of all dividends you received during this period
(5) Withholding tax is the amount of withholding tax taken from your dividends (see this guide for more on this)
(6) Commissions represent the fees paid to Interactive Brokers (i.e. transaction fees, exchange fees, or brokerage fees if you have less than 100kCHF with them)
(7) Other FX translations represents the fluctuation of your cash in foreign currencies. For example, if you have USD in your portfolio, and the rate has dropped compared to the base currency of your Interactive Brokers account — CHF in our case — then you will see this difference here
(8) Time weighted return (TWR) represents the performance in % between the initial value of your portfolio at the beginning of the period and at the end of the period.
There are two ways to measure the performance in % of your securities. And Interactive Brokers offers you both choices: Time-Weighted Return (called TWR) and Money-Weighted Return (called MWR).
To put it simply, the TWR lets you know the return between two dates without taking into account the movements in the account (like cash deposits/withdrawals and stock purchases/sales). It's great if you want to compare two portfolios together.
The MWR on the other hand allows you to know the performance in % of your portfolio by taking into account all those cash and stock purchase/sale movements. It is ideal when you want to know your own return.
For my part, I use the MWR in order to take into account my Mustachian decisions when I invest in the stock market (i.e. regularly following my process, as well as at the time of the sales when there are stock market crashes).
As you will have understood, this simple section is enough to know the situation of your Interactive Brokers portfolio at a glance.
But if you want to have even more details, then you just have to look at the following sections:
Dividends
In the screenshot below, you can see the dividends I received in March 2021 through Interactive Brokers:
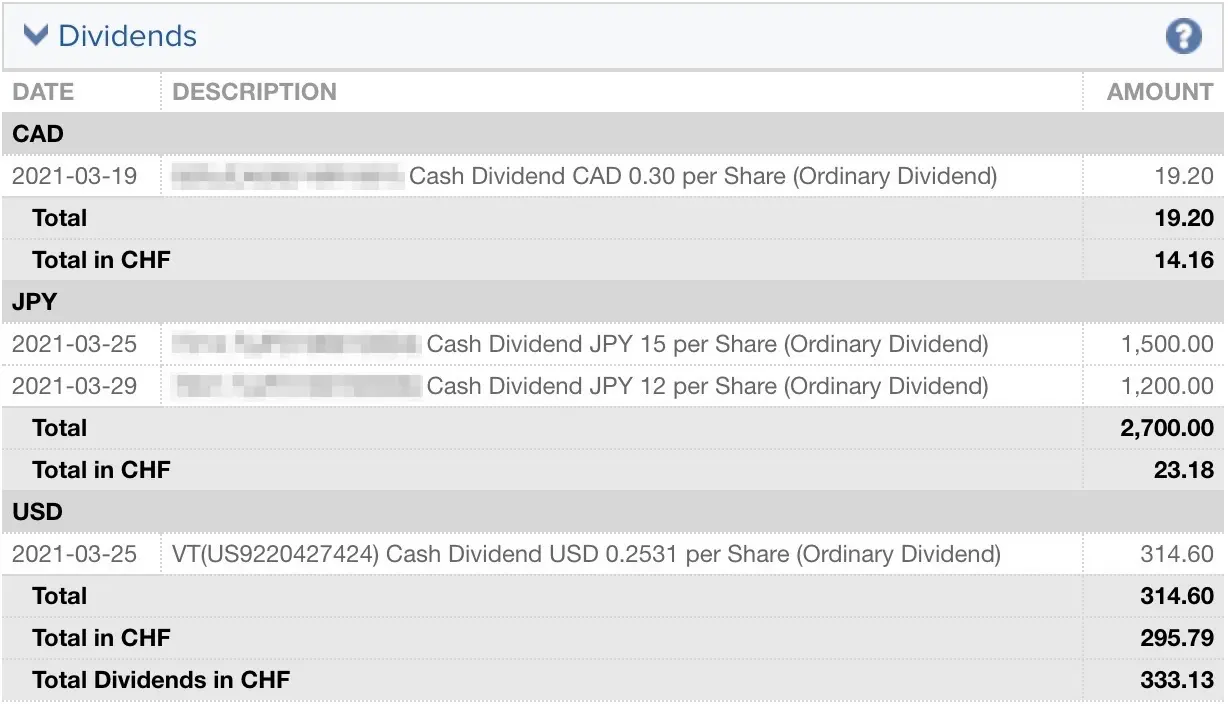
(I am hiding the first 3 stocks because they are part of my Daubasses portfolio)
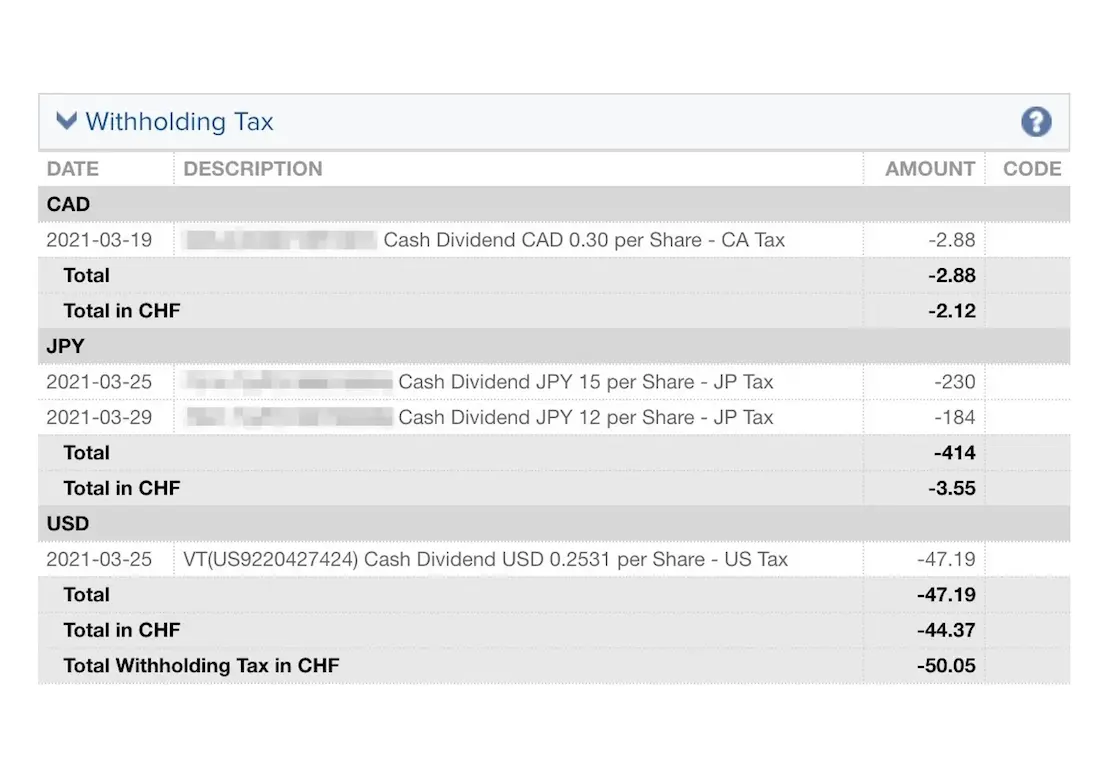
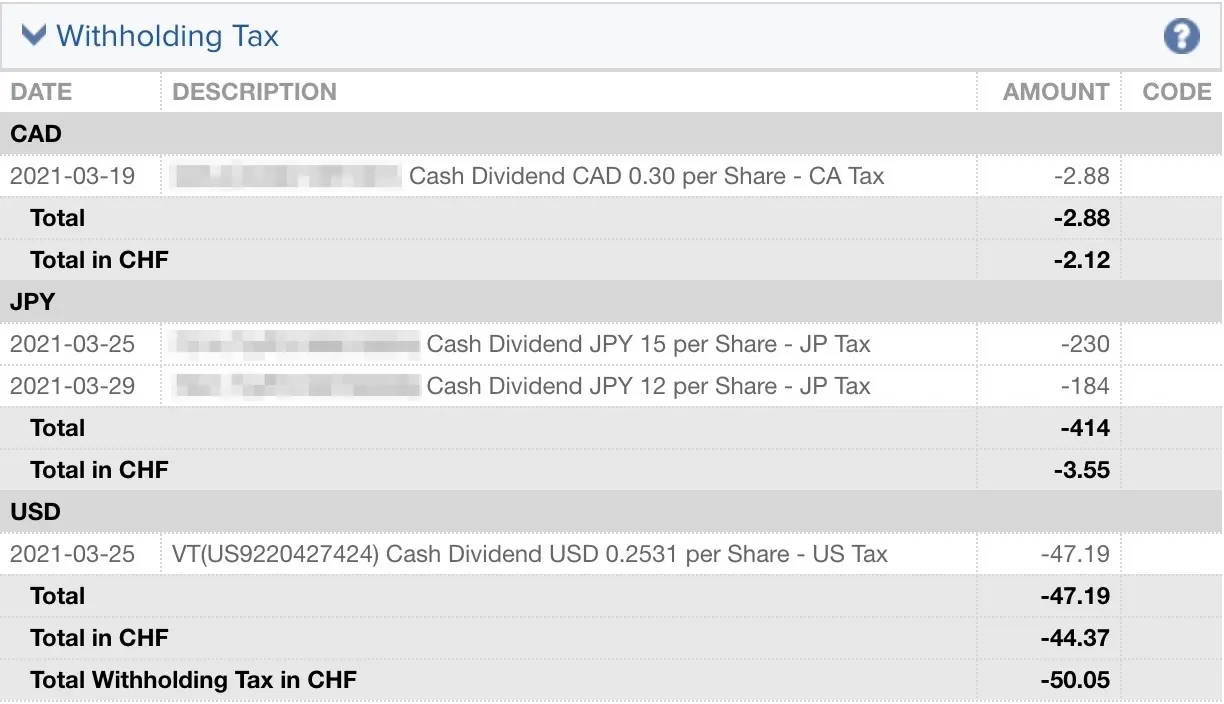
Withholding Taxes
Dividends mean withholding taxes from the countries where the companies paying you are located. In my example below, it is the Canadian, Japanese, and US governments that are taking money from me:
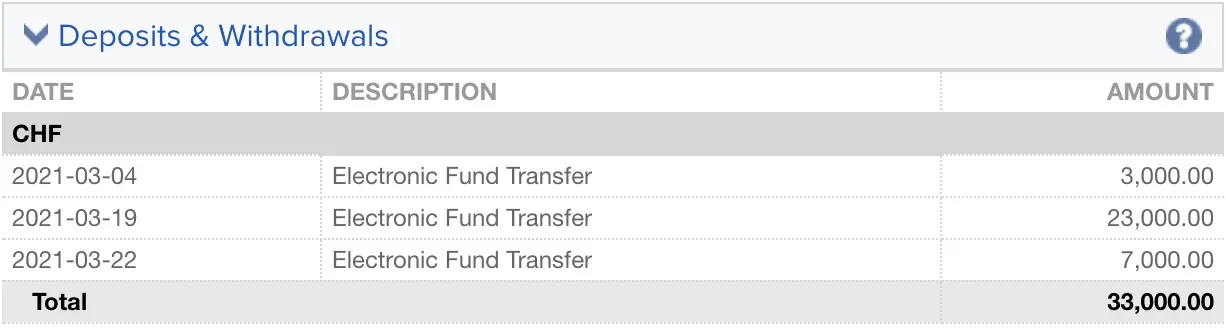
Deposits and Withdrawals
In practical terms, your deposits and withdrawals are not money that you “earn”, but simply a transfer from one of your bank accounts to your Interactive Brokers brokerage account type, and vice versa. But I thought it was important to show you that you can also see these transactions from this report:
Trades
And, finally, you can also see on this report all the trades you have made for a given month (for example if you buy stocks and ETFs or if you are exchanging currency):
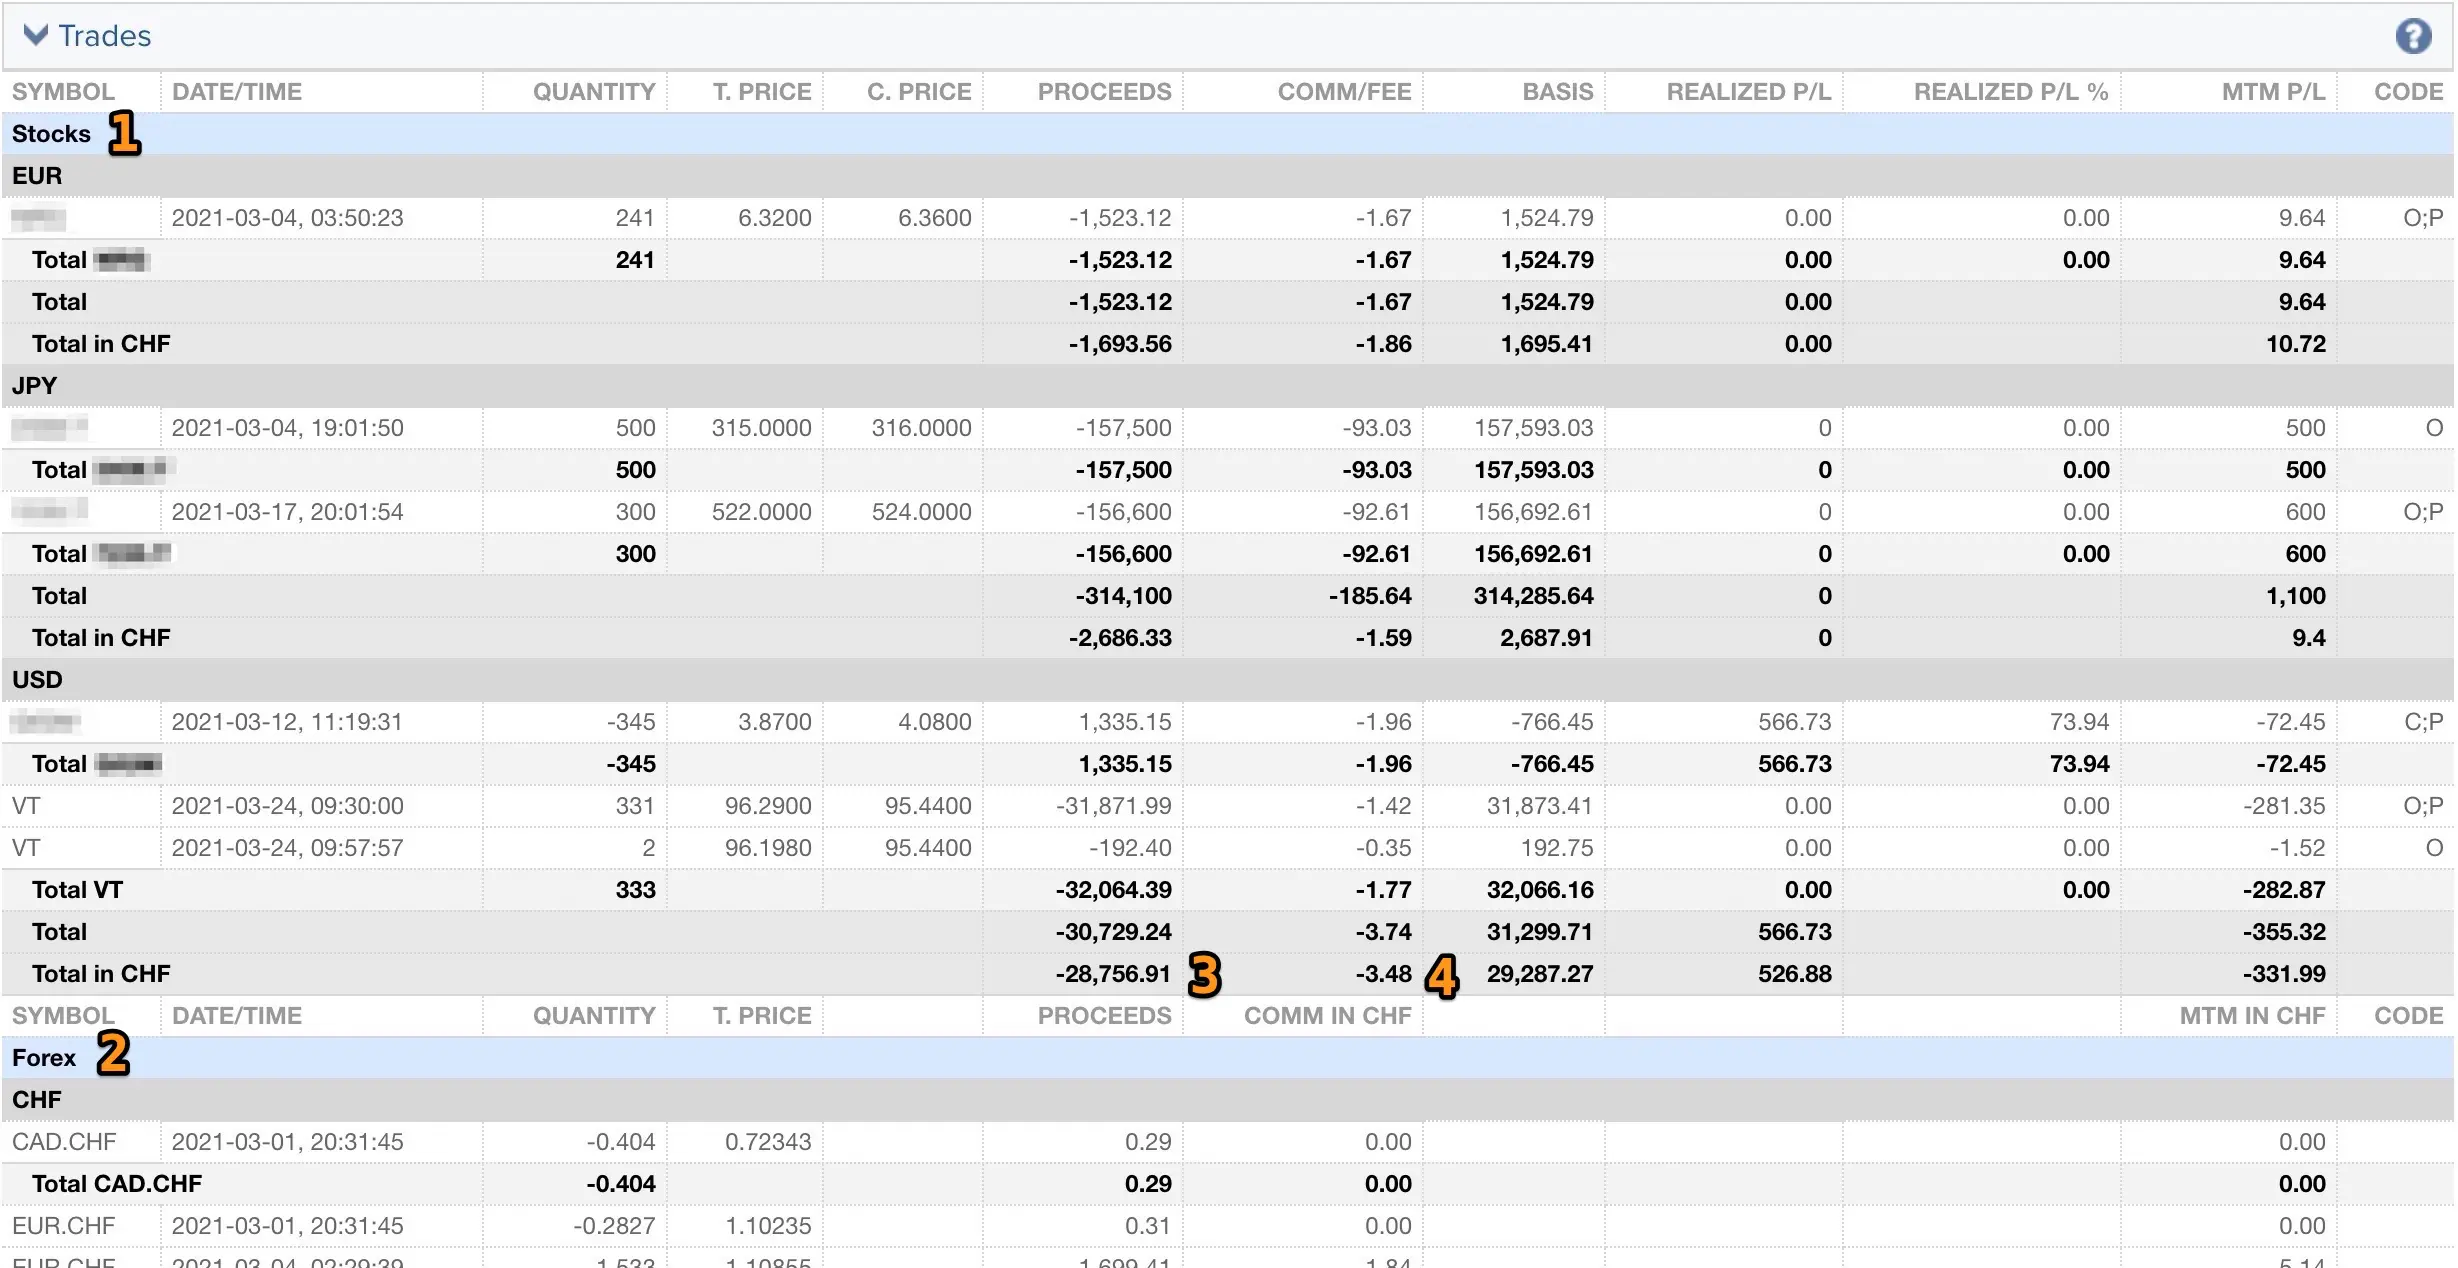
(1) Under “Stocks” are all the purchases and sales I have made.
(2) Under “Forex” are all my currency exchange transactions
(3) Here you can see the amount in CHF of what I bought as shares in USD, and at point (4), you can observe the frugal fees charged by Interactive Brokers :)
(note: it’s rare that I have so many different trades, as I normally only buy my favorite VT ETF, and Daubasses shares from time to time like this month when there are very good deals — but I figured this way you have a good concrete example of different trades in different currencies)
This Interactive Brokers “Activity Report” section is really neat (one more reason to choose IBKR), and allows you to see all the details of your portfolio.
Then, when it comes to pure performance, there is one last Interactive Brokers tool that I want to introduce to you: the PortfolioAnalyst.
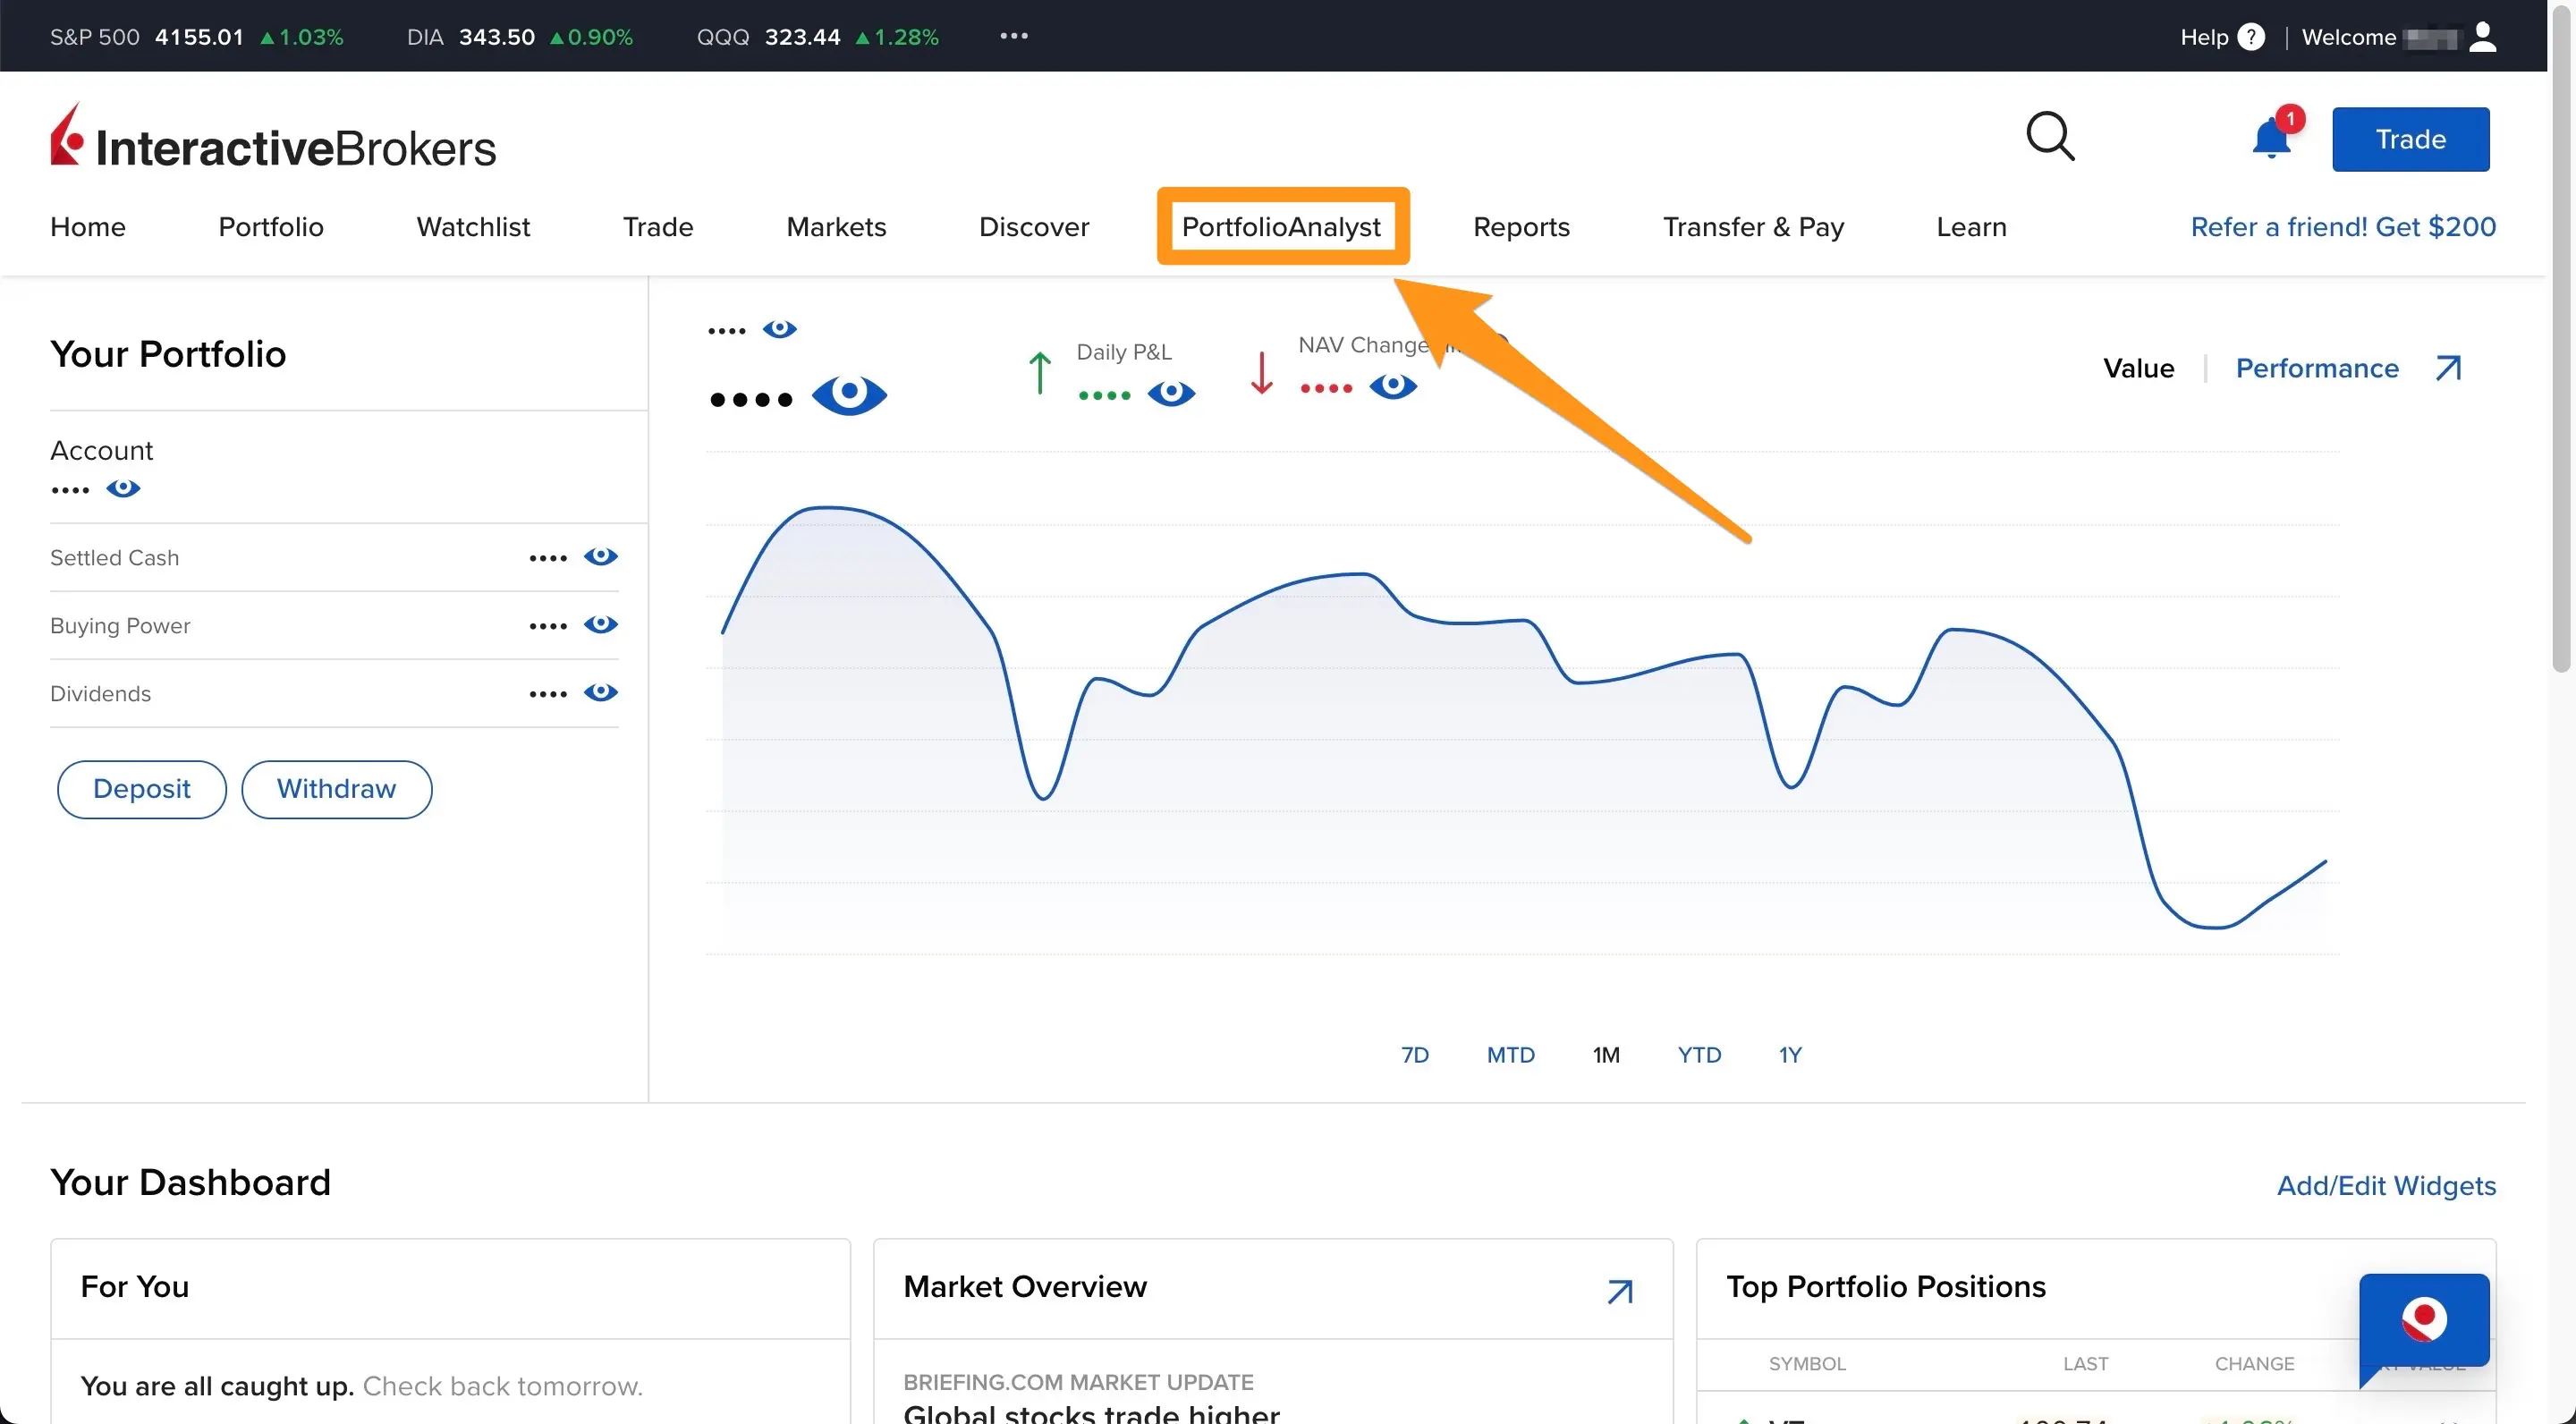
Interactive Brokers PortfolioAnalyst Tool
PortfolioAnalyst, as its name suggests, allows you to analyze your portfolio of securities from every angle.
Swiss and European investors can access it via various links on the Interactive Brokers platform, notably in the main menu:
When you arrive, you see this screenshot:
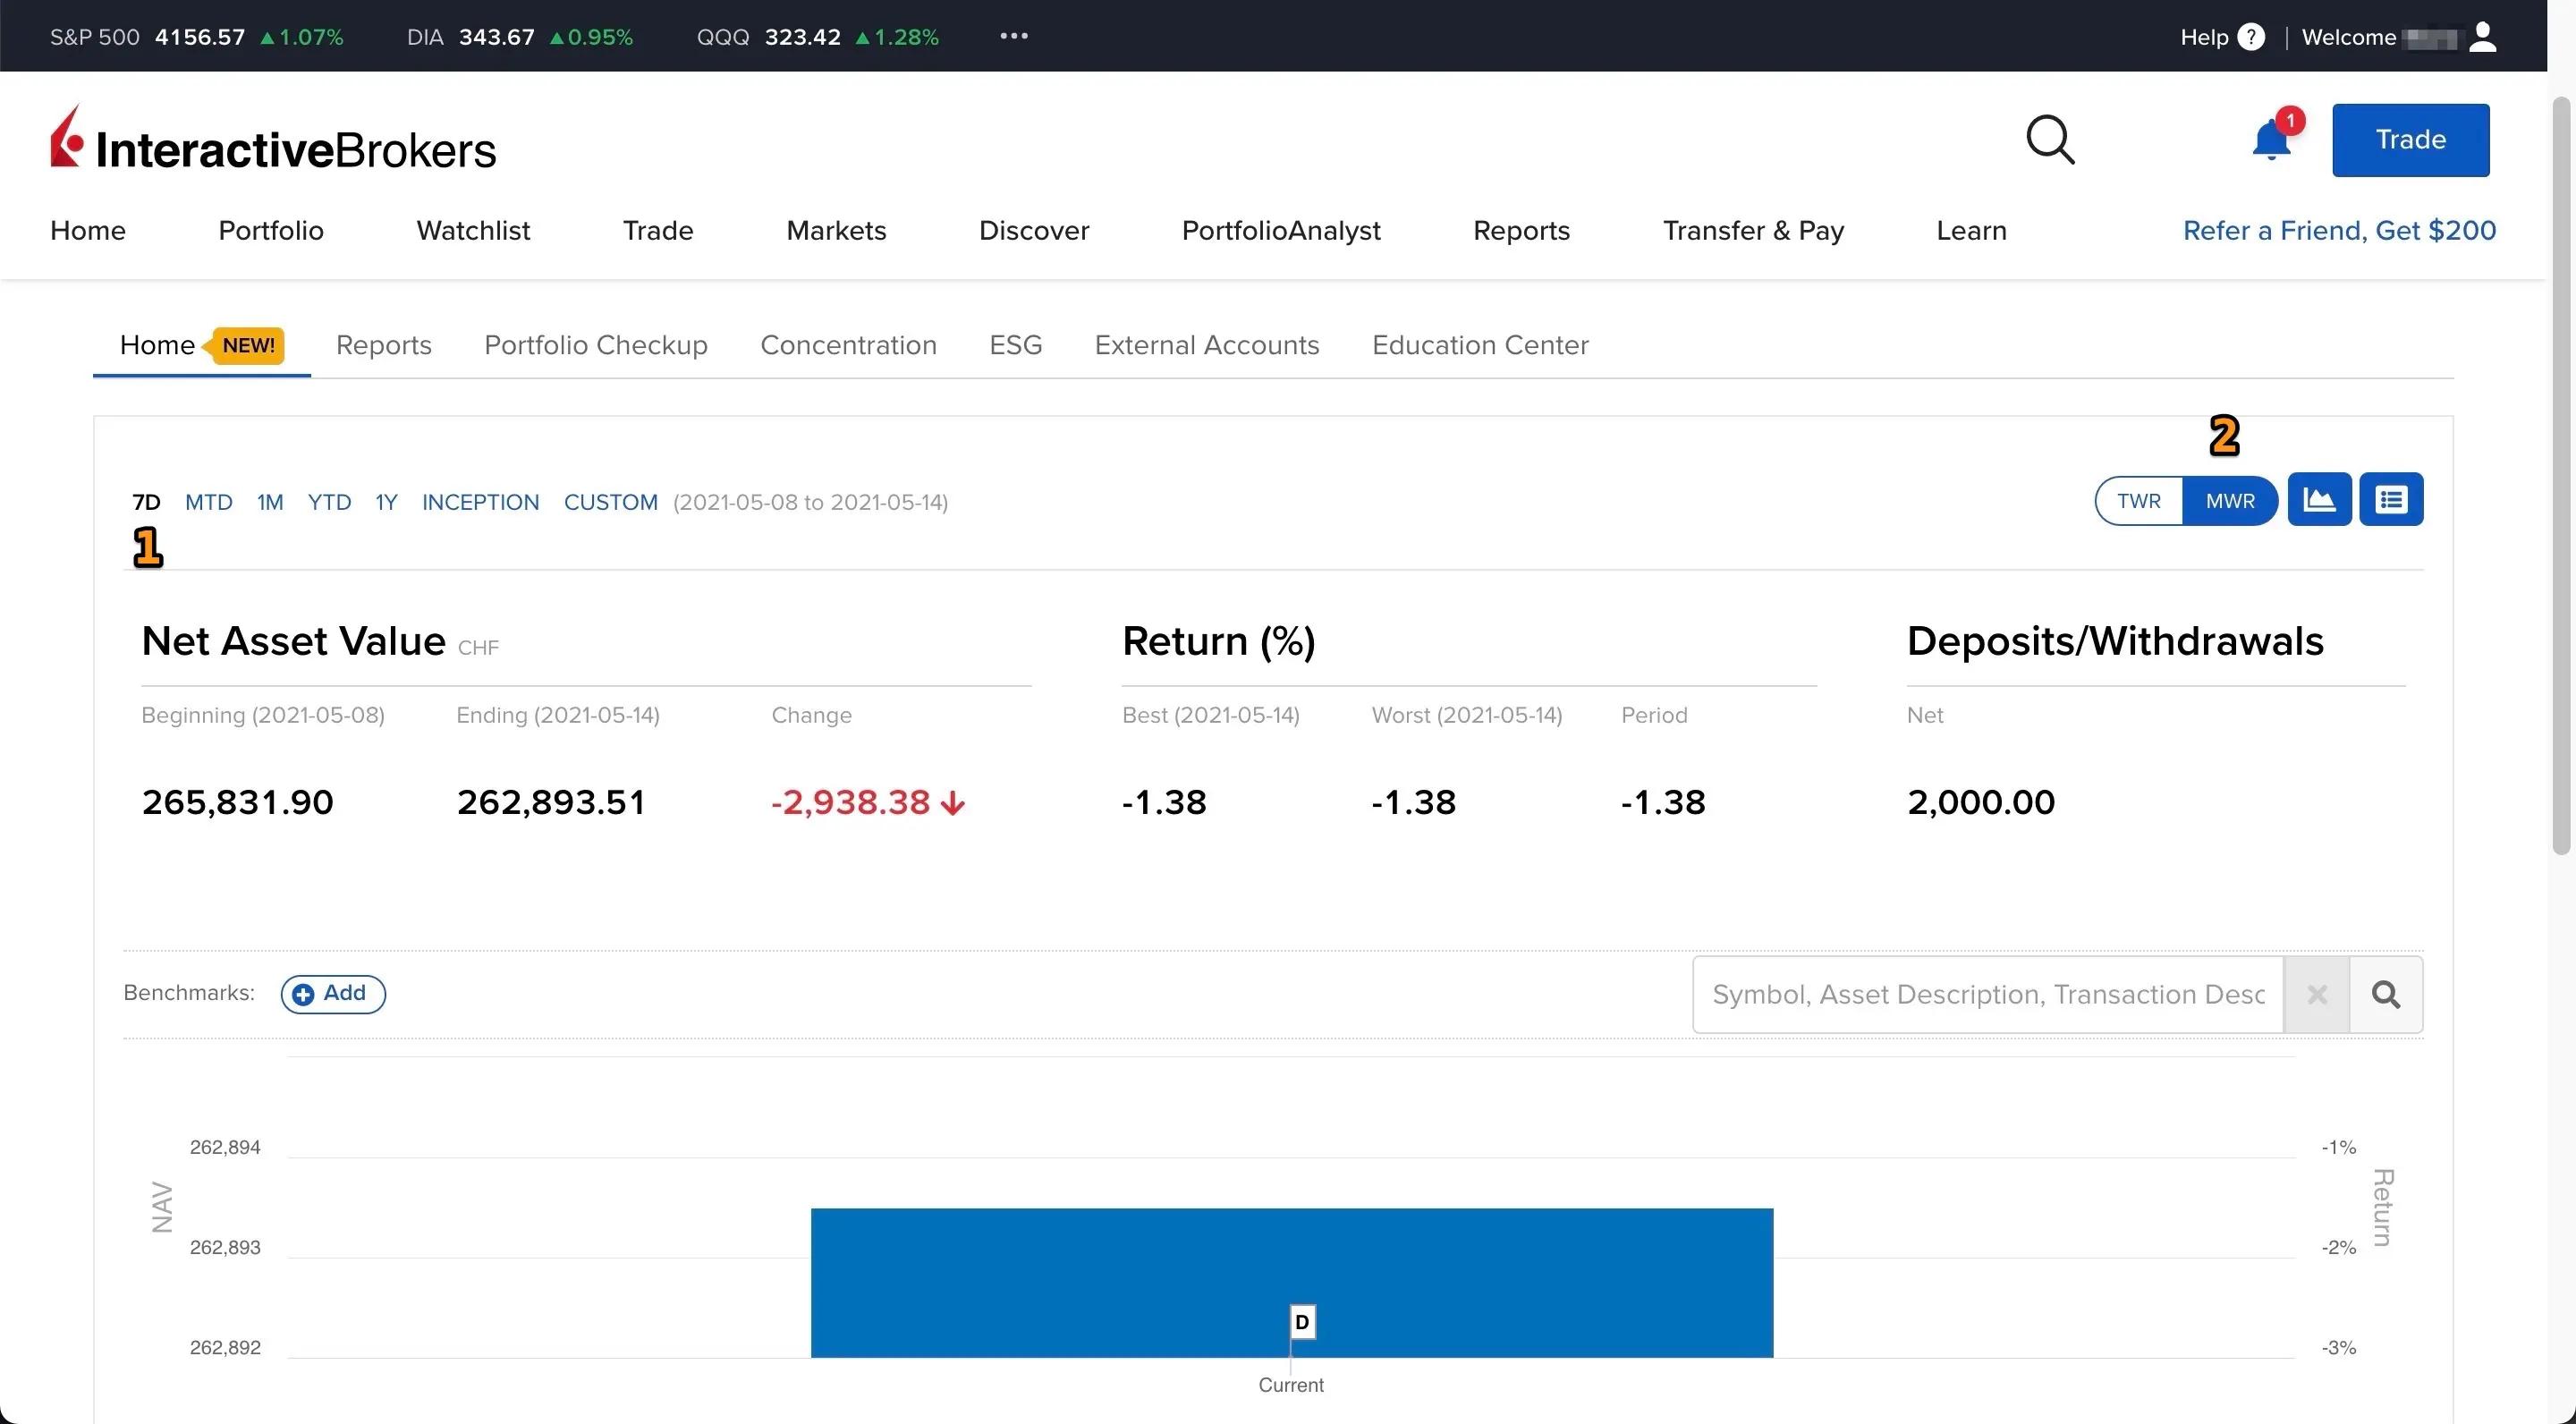
(1) By default, the PortfolioAnalyst dashboard shows you your portfolio information for the last 7 days. In the next screen, we’ll change it to “Inception”, which means “since you opened your account with Interactive Brokers”
(2) Also, by default, the PortfolioAnalyst is set to TWR (see box above). As you can see, I chose MWR because it is the setting that suits me
So when I click on “Inception”, this is what I see with my MP portfolio:
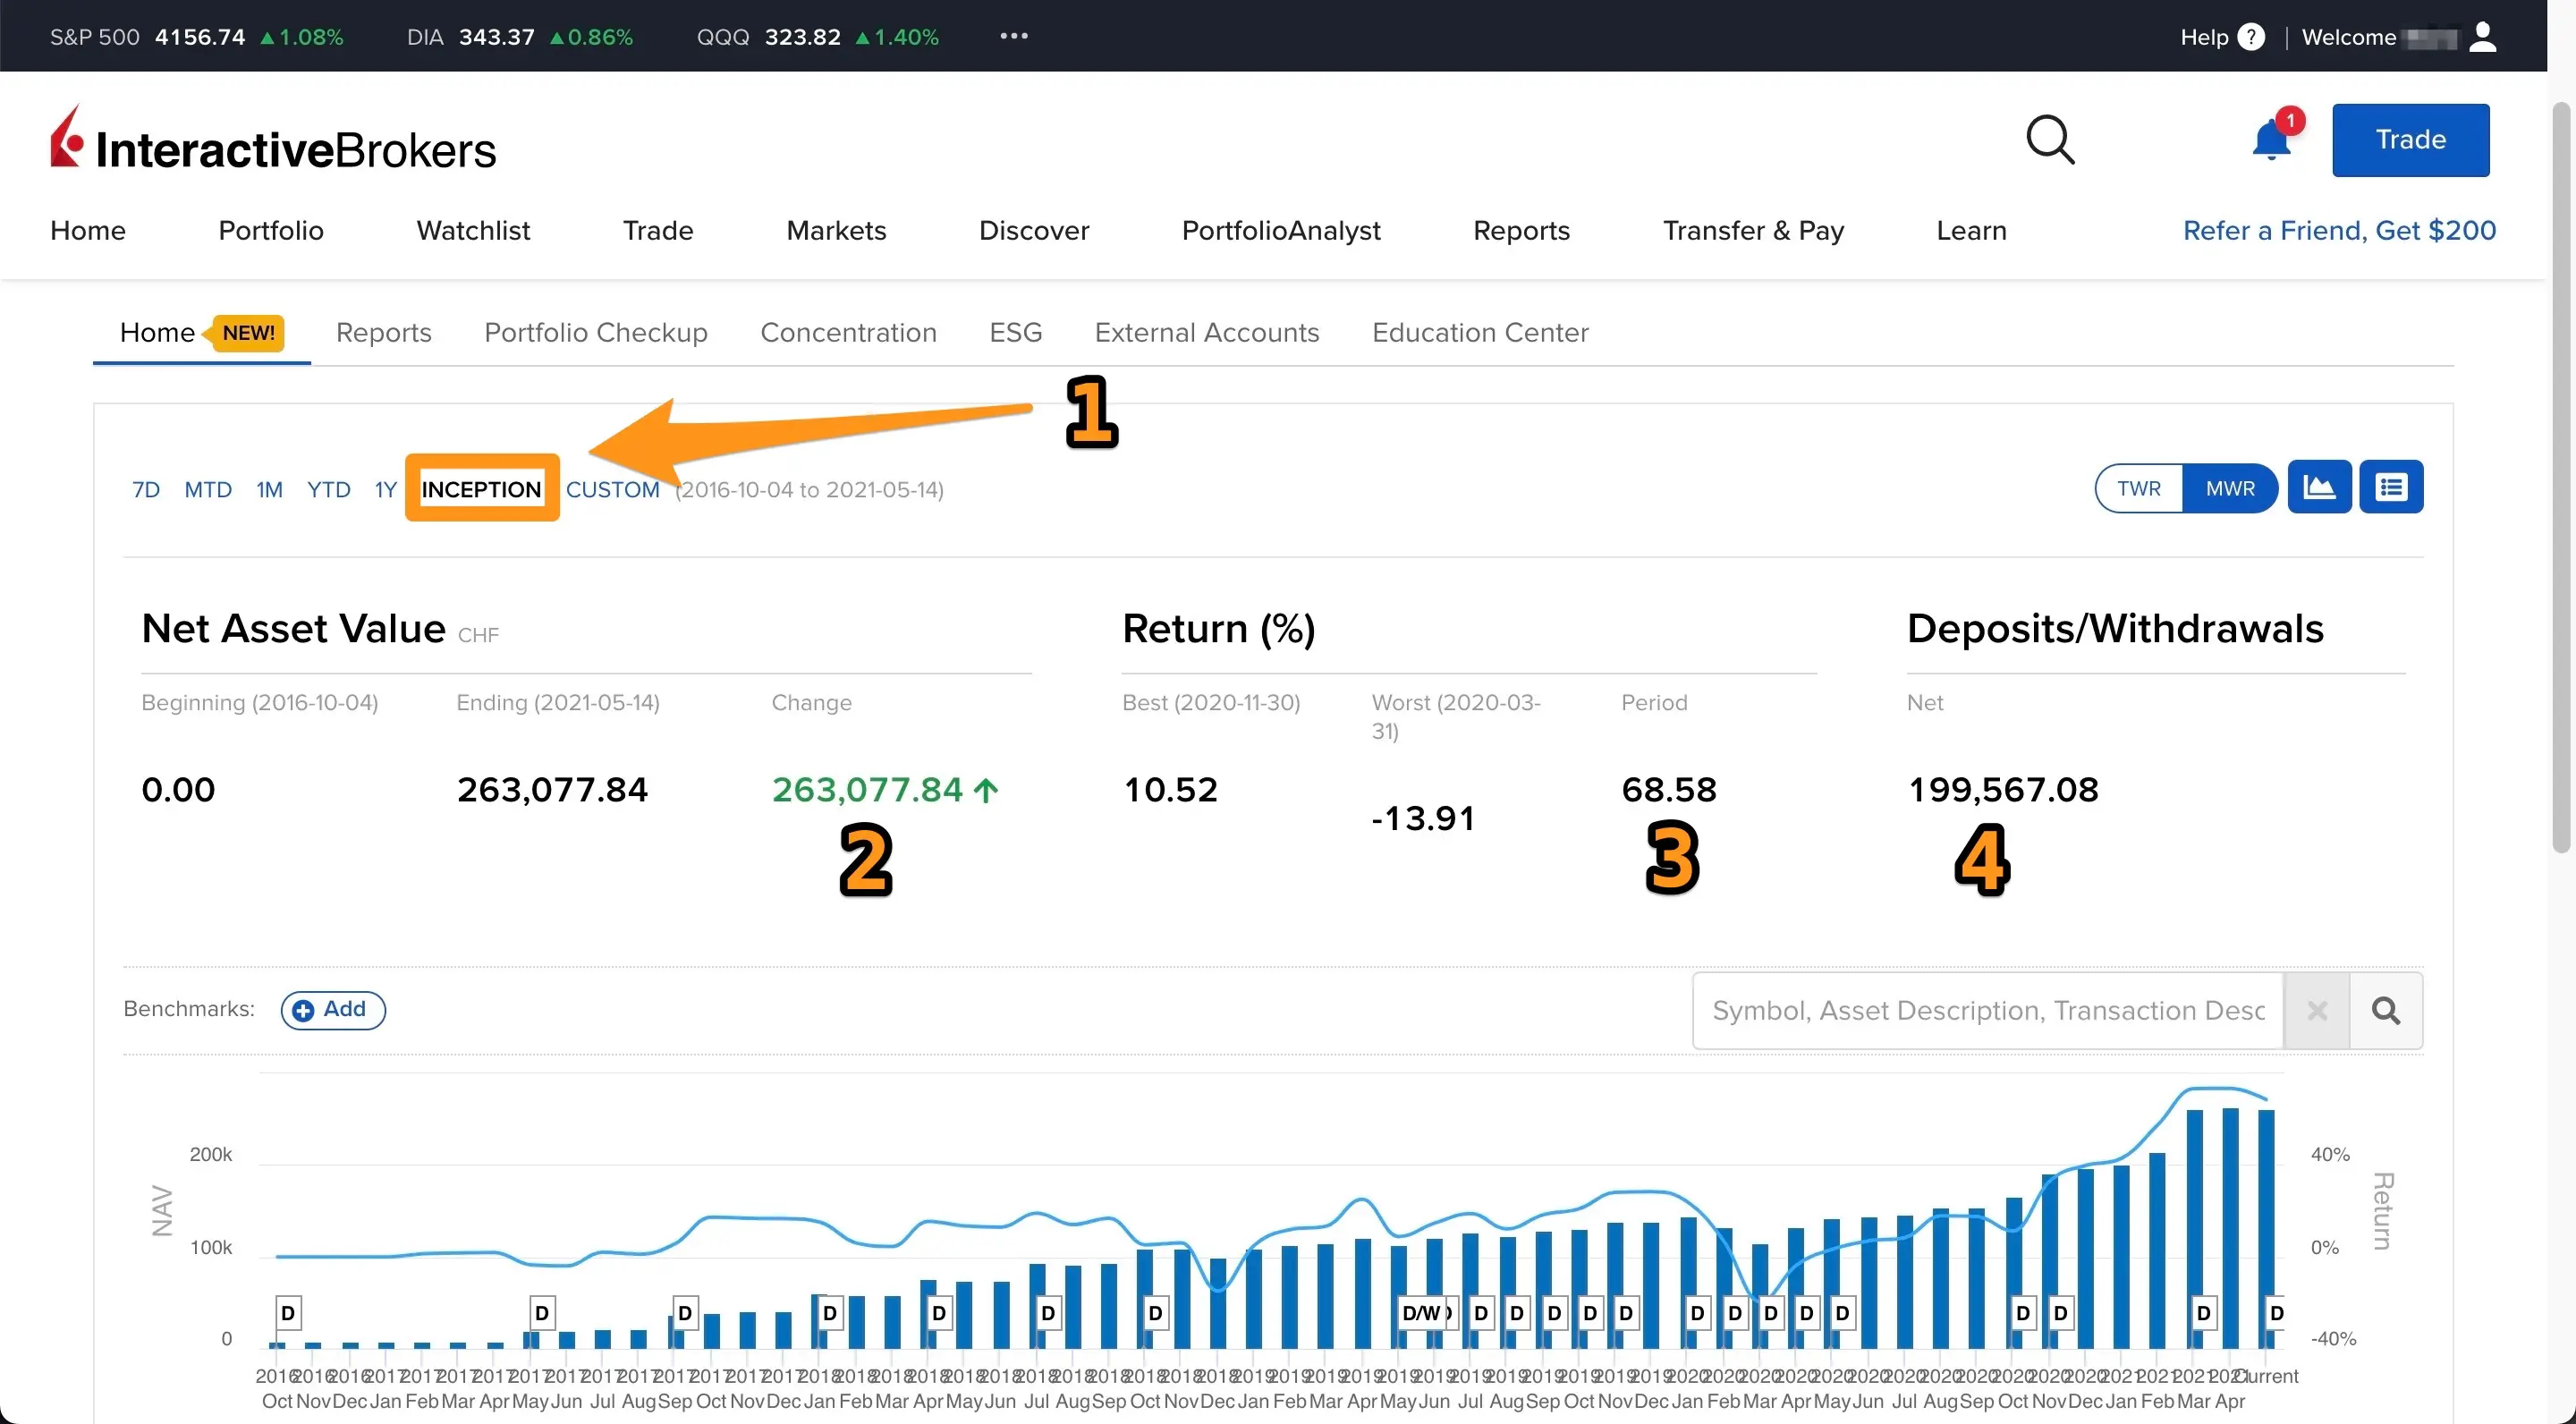
(1) Inception allows you to set the start date as the date I started investing with Interactive Brokers, and the end date as today
(2) Change shows you the variation of my portfolio which went from CHF 0.00 on day 1, to CHF 263'969.65 today
(3) Period indicates the performance between my beginnings as a Swiss investor and today
(4) Net indicates my total deposits and withdrawals
Then, on the same Interactive Brokers “PortfolioAnalyst” screen, you can scroll down a bit to see the performance breakdown by your asset classes:
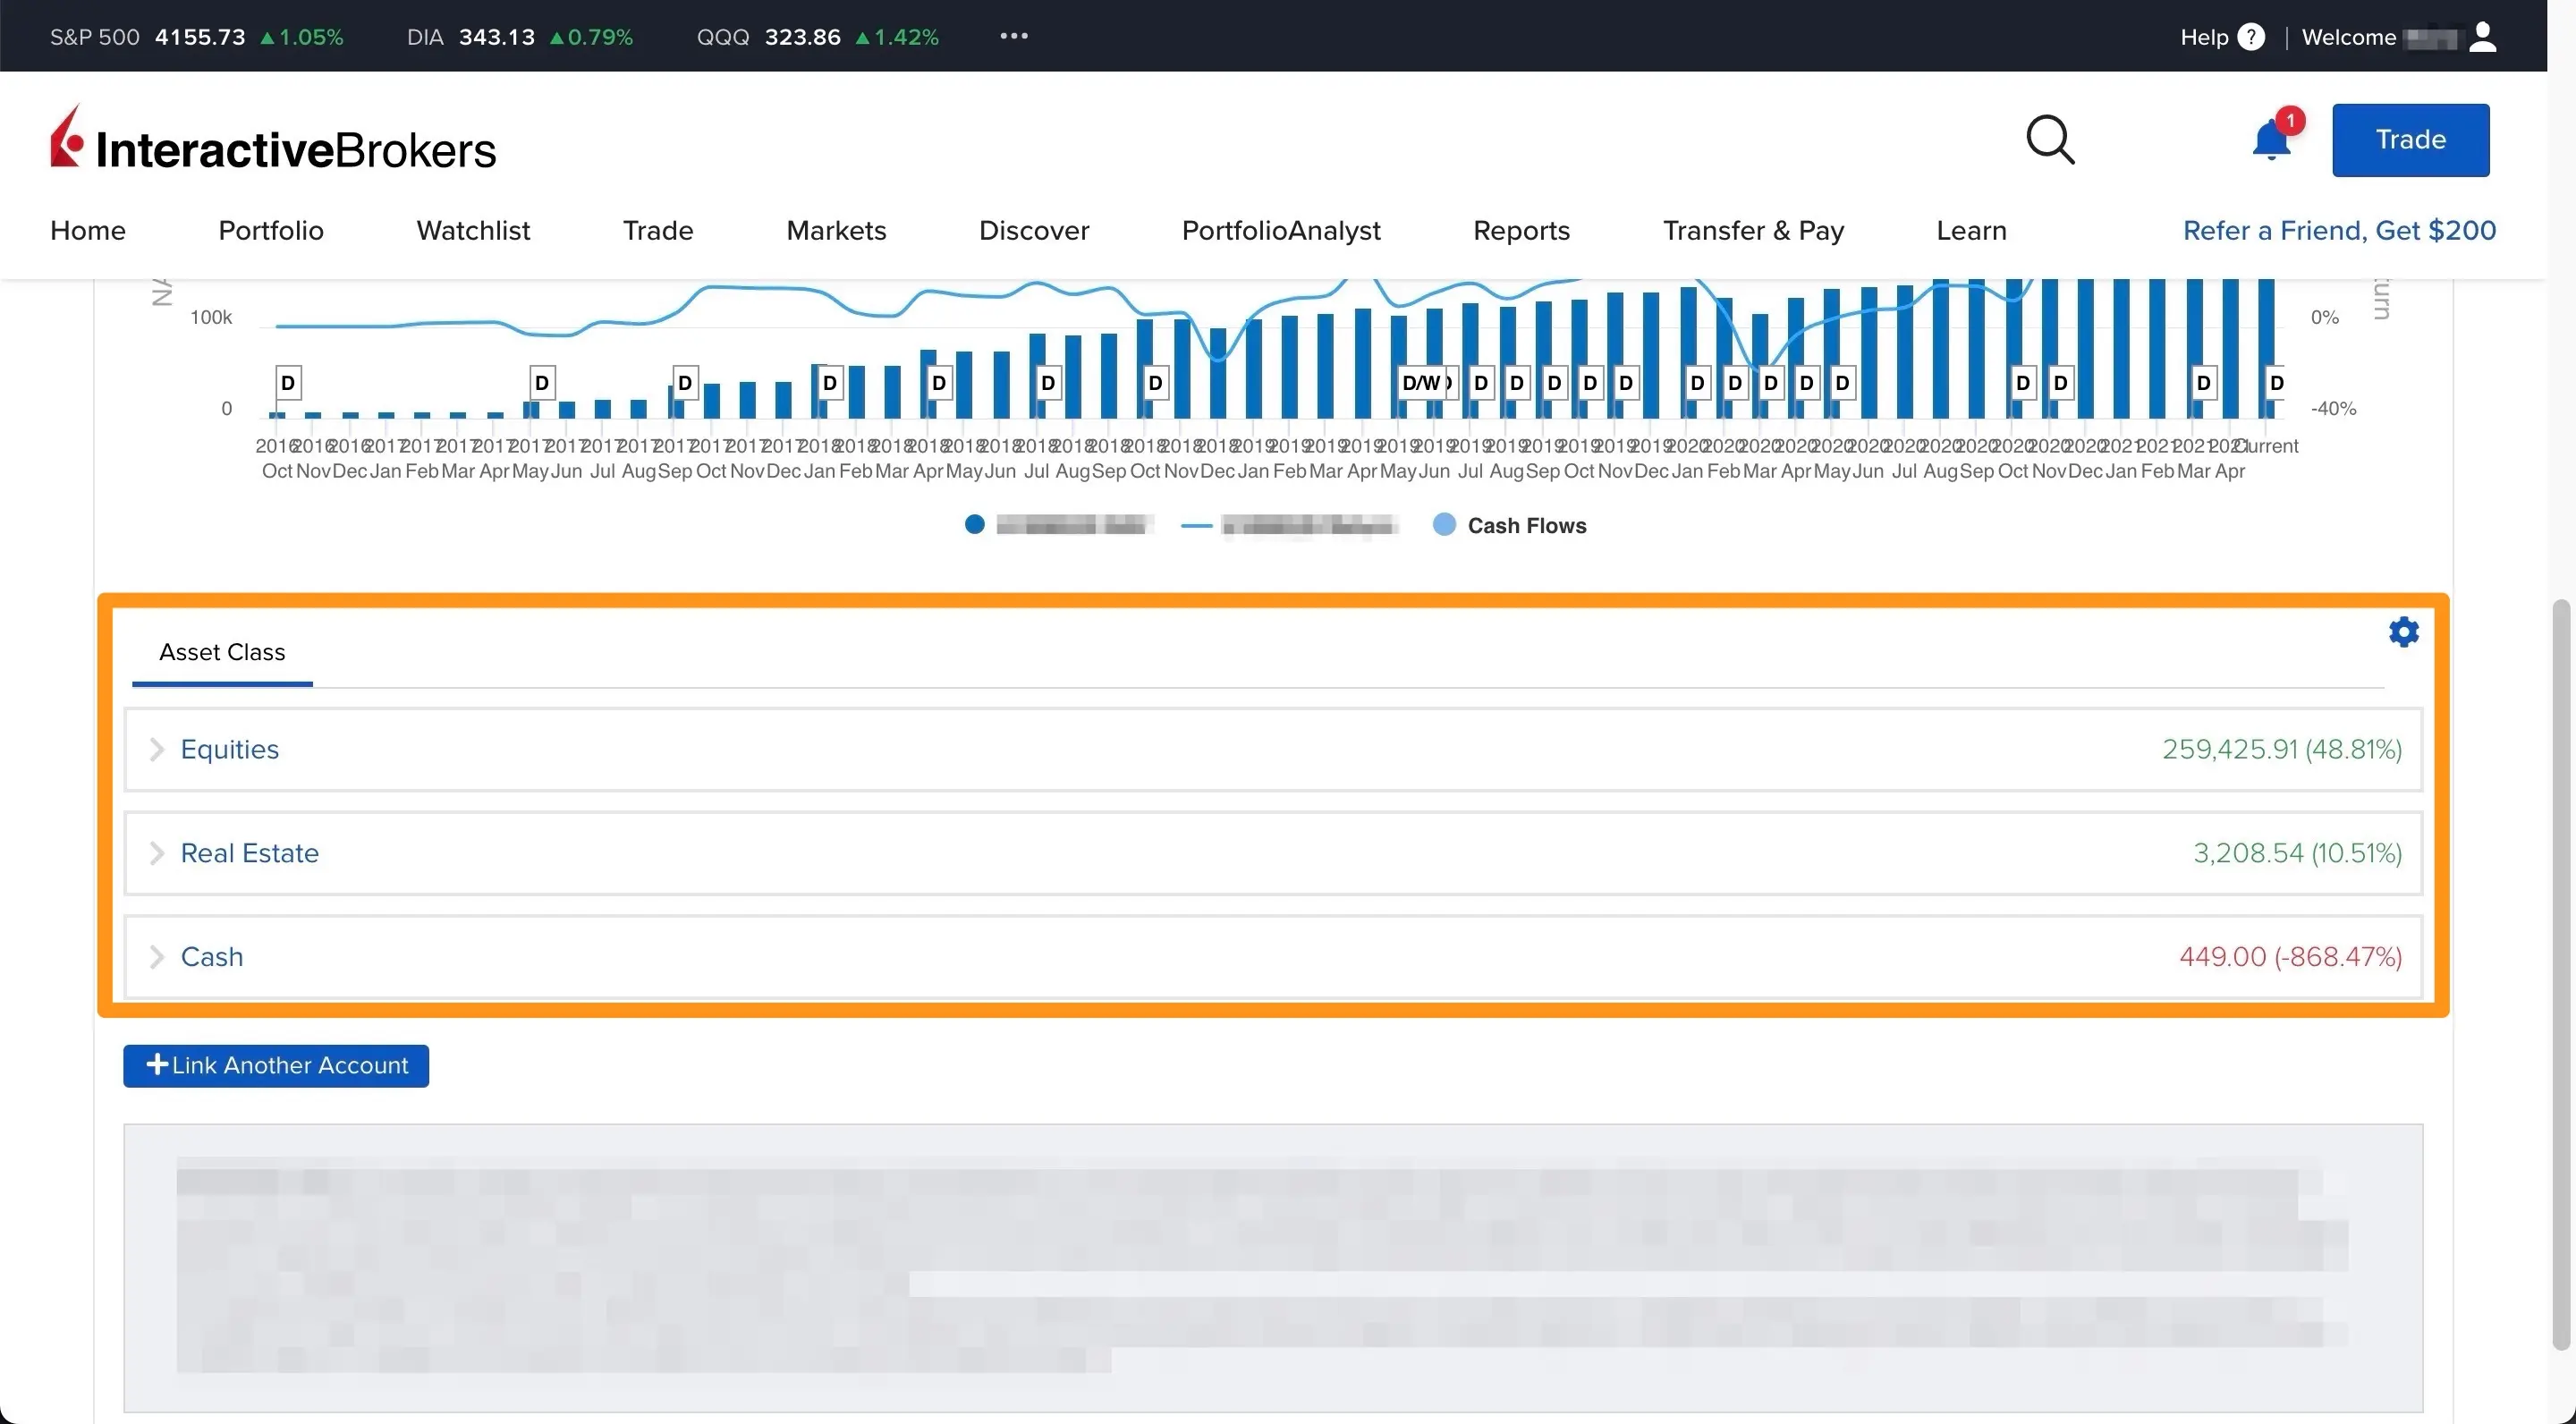
Performance of my Interactive Brokers portfolio separated by asset class (here: ETFs, stocks with real estate, and cash)
If you only own ETFs, then you will only see “Equities” (your ETFs) and “Cash” (your cash). In my case, the real estate is due to Daubasses shares which invest mostly in real estate.
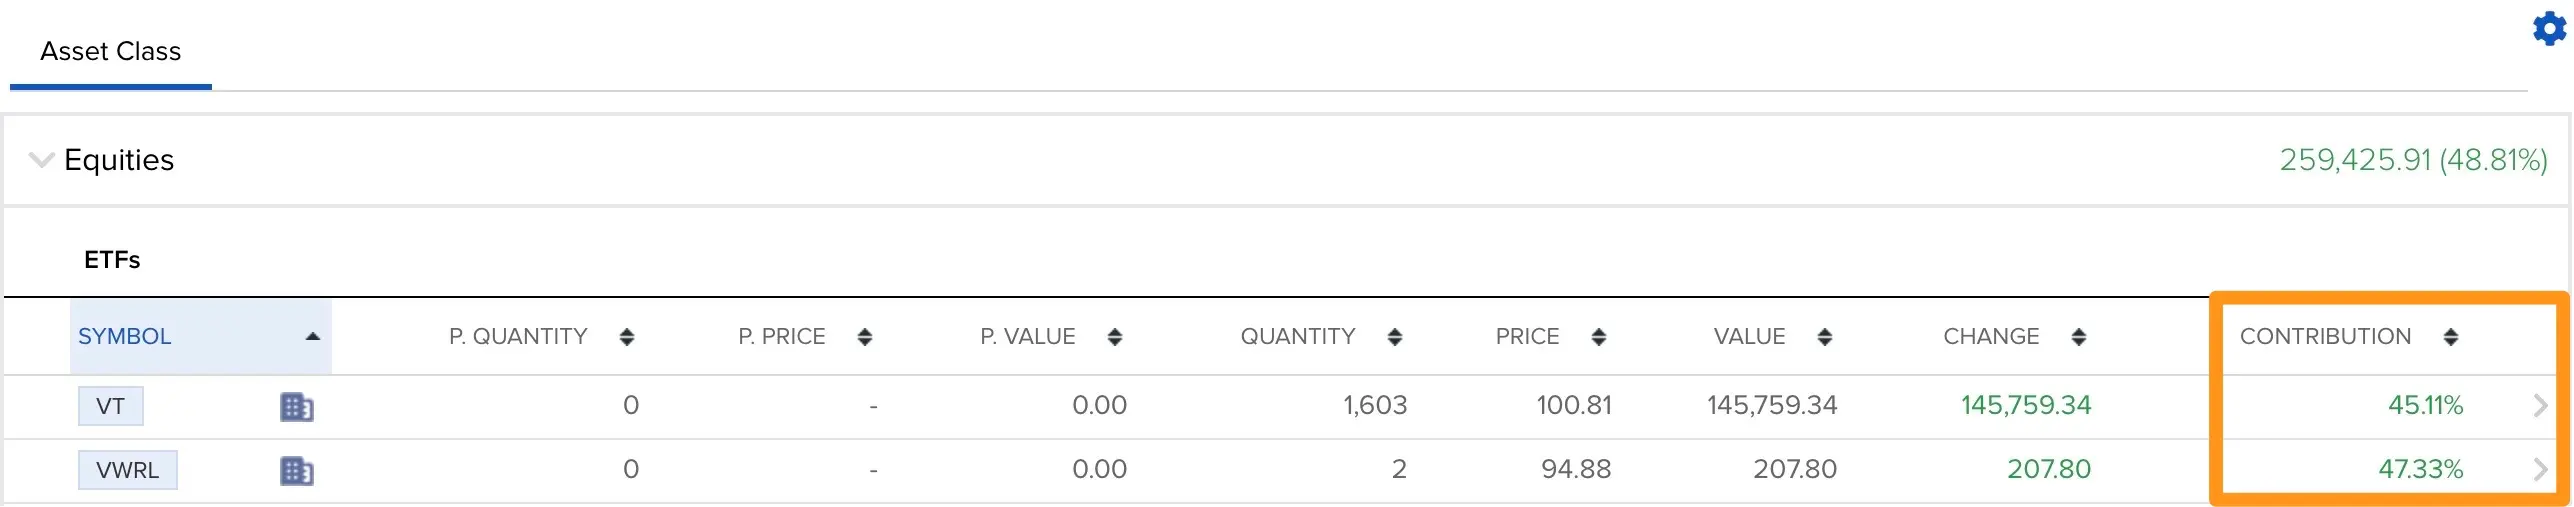
The most interesting thing to see is when you click on “Equities” to see the details of your performance by ETF:
Now that you've seen where to find the performance of your Interactive Brokers portfolio, you may be wondering how you can tell if you're hitting the famous 6-8% in order to reach the FIRE status? What you need to understand is that the performance we have seen so far is the so-called "nominal" performance, i.e., between two dates. If you want to compare yourself to the annualized return that we talk about in the [FIRE (Financial Independence, Retire Early)](/fire-financial-independence-retire-early/) world, you have to calculate this return using a calculator like the one of Moneyland.. I discuss this topic in more detail in this article too.
So now you know where to find the performance information for your stock market investments via your Interactive Brokers account.
In the next chapter, I will explain in detail how I find my tax information (Swiss tax return) on Interactive Brokers.